
Do you want to learn how to trade Forex with a simple and effective strategy that can help you follow the trend and capture consistent profits? If yes, then you should pay attention to this article, because we’re going to teach you how to use the Keltner Channel pullback strategy to trade Forex like a pro.
Keltner Channels are a popular technical indicator that can help you identify the current trend and spot potential pullback points. A pullback is when the price moves against the trend for a short period of time before resuming its original direction. Pullbacks offer traders an opportunity to enter the market at a better price and ride the trend until it ends.
In this article, we’ll explain what Keltner Channels are and how they are calculated, how to set them up on your trading platform, how to trade Keltner Channel pullbacks, and how to improve your Keltner Channel pullback strategy with some tips and tricks. By the end of this article, you’ll have a clear understanding of how to use Keltner Channels to trade Forex successfully.
How to Set Up Keltner Channels on Your Trading Platform
Keltner Channels are a combination of two other indicators: the exponential moving average (EMA) and the average true range (ATR). The EMA is a type of moving average that gives more weight to recent prices and less weight to older prices. The ATR is a measure of volatility that shows how much the price fluctuates over a certain period of time.
The Keltner Channel consists of three lines: a middle line, an upper band, and a lower band. The middle line is typically a 20-period EMA, which represents the average price over the last 20 periods. The upper band is calculated by adding a multiple of the ATR to the middle line, and the lower band is calculated by subtracting a multiple of the ATR from the middle line. The multiple is usually 2, but you can adjust it based on your preference. The higher the multiple, the wider the channel; the lower the multiple, the narrower the channel.
To add Keltner Channels to your chart, you need to follow these steps:
- Open your trading platform and select the currency pair and time frame you want to trade.
- Go to the indicators menu and find Keltner Channels. If you don’t see it, you may need to download it from an online source or install it manually.
- Click on Keltner Channels and adjust the parameters as follows: EMA Period = 20, ATR Period = 10, ATR Multiplier = 2. You can also change the colors and styles of the lines if you want.
- Click OK and you should see Keltner Channels appear on your chart.
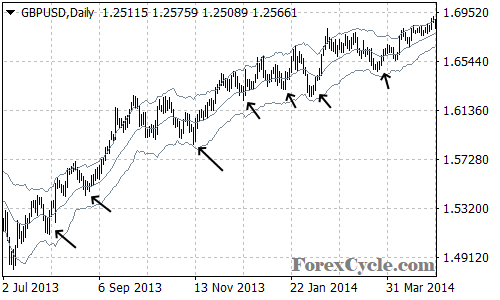
Here is an example of how Keltner Channels look like on a daily chart of GBP/USD:
How to Trade Keltner Channel Pullbacks
The basic idea behind trading Keltner Channel pullbacks is to buy when the price pulls back to the middle line or the lower band in an uptrend and sell when the price pulls back to the middle line or the upper band in a downtrend. This allows you to enter the market at a favorable price and follow the trend until it changes.
However, before entering a trade, you should also consider some other factors, such as:
- The direction and strength of the trend. You should only trade pullbacks in the direction of the dominant trend. For example, if the price is making higher highs and higher lows, you should only look for bullish pullbacks. If the price is making lower highs and lower lows, you should only look for bearish pullbacks. You can use other indicators or tools, such as trend lines or moving averages, to determine the trend direction and strength.
- The size and shape of the candlestick. You should look for pullbacks that are confirmed by small and clear candlesticks that close near their highs or lows. This shows weak momentum and retracement in the opposite direction of the trend. You should avoid pullbacks that are accompanied by large or indecisive candlesticks that close near their middles. This shows strong momentum and reversal in the opposite direction of the trend.
- The volume and volatility. You should look for pullbacks that occur on low volume and volatility. This shows low interest and participation in the market and increases the chances of a continuation of the trend. You should avoid pullbacks that occur on high volume and volatility. This shows high interest and participation in the market and increases the chances of a change of the trend.
Once you identify a valid pullback, you should enter the trade as soon as possible and place a stop-loss order above the upper band for a sell trade or below the lower band for a buy trade. This will protect you from a sudden reversal or a failed pullback.
You should also place a take-profit order at a reasonable distance from your entry point, based on your risk-reward ratio and the market conditions. You can use the ATR indicator to measure the average price movement and set your target accordingly. For example, if the ATR is 50 pips, you can set your target at 100 pips, which gives you a 2:1 risk-reward ratio.
Here are some examples of Keltner Channel pullback trades on a daily chart of GBP/USD:
How to Improve Your Keltner Channel Pullback Strategy
Trading Keltner Channel pullbacks can be a profitable strategy, but it also has some challenges and pitfalls that you need to be aware of and avoid. Here are some tips and tricks that can help you improve your Keltner Channel pullback strategy and increase your trading performance:
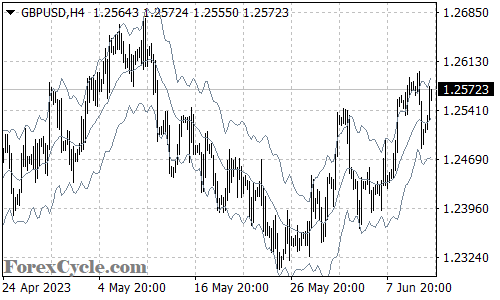
- Use multiple time frames. You can use a higher time frame to identify the main trend and a lower time frame to find the best entry points. For example, you can use a daily chart to determine the trend direction and a 4-hour chart to trade the pullbacks. This way, you can filter out some of the noise and false signals that may occur on lower time frames.
- Filter out false signals with other indicators. You can use other indicators or tools, such as RSI, MACD, Stochastic, Fibonacci retracements, support and resistance levels, etc., to confirm your pullback signals and avoid false ones. For example, you can use RSI to check if the price is overbought or oversold before entering a pullback trade. If the price is overbought and pulls back to the upper band in an uptrend, you may want to wait for a divergence or a cross below 70 before buying. If the price is oversold and pulls back to the lower band in a downtrend, you may want to wait for a divergence or a cross above 30 before selling.
- Combine with other strategies. You can use Keltner Channel pullbacks as part of a larger trading system or strategy that incorporates other elements, such as fundamental analysis, news events, economic data, etc. For example, you can use Keltner Channel pullbacks to trade major news releases or economic reports that can cause large price movements in the market. You can also use Keltner Channel pullbacks to trade in conjunction with other strategies, such as trend following, swing trading, scalping, etc.
Conclusion
Keltner Channels are a powerful technical indicator that can help you trade Forex with a simple and effective strategy that can follow the trend and capture consistent profits. By using Keltner Channel pullbacks, you can identify potential entry and exit points in the direction of the trend and take advantage of low volatility and momentum.
However, you should also be aware of the challenges and pitfalls of trading pullbacks and use some tips and tricks to improve your Keltner Channel pullback strategy and increase your trading performance. You should also practice and test your strategy on a demo account before going live and always follow sound risk management principles.
We hope you enjoyed this article and learned something new about Keltner Channels and how to trade them in Forex. If you have any questions, comments, or feedback, please feel free to leave them below. We’d love to hear from you and help you out with your trading journey.
Happy trading! 🚀