
Forex trading, with its dynamic nature and vast profit potential, demands the adoption of effective technical analysis tools. One such tool that has gained popularity among traders is the Keltner Channel. Developed by Chester Keltner, this indicator provides valuable insights into price volatility and potential trend reversals. In this article, we will explore the concept, construction, and practical application of Keltner Channels in Forex trading.
Understanding Keltner Channels:
The basic definition of Keltner Channels.
Keltner Channels are a technical analysis tool used in Forex trading to assess price volatility and identify potential trading opportunities. They consist of three main components: the centerline, the upper band, and the lower band.
The centerline is derived from an exponential moving average (EMA) of the price. The EMA calculates the average price over a specified period, giving more weight to recent prices. Typically, a 20-period EMA is used, but traders can adjust this parameter based on their trading style and preferences. The centerline acts as a reference point for assessing the prevailing price trend.
The upper band is constructed by adding a multiple of the average true range (ATR) to the centerline. The ATR measures the average price range over a specified period, providing insights into price volatility. Traders commonly use a multiple of 2 times the ATR to determine the width of the upper band.
The lower band is formed by subtracting the same multiple of the ATR from the centerline. Like the upper band, the width of the lower band is determined by the chosen multiple.
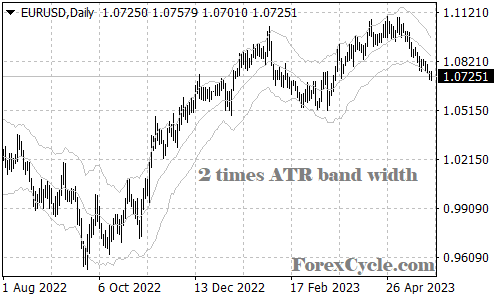
Together, the upper and lower bands create a channel that surrounds the price action. The width of the channel expands and contracts based on changes in volatility. During periods of high volatility, the channel widens, indicating increased potential for price fluctuations. Conversely, during low volatility periods, the channel narrows, signaling decreased price movement.
Traders utilize Keltner Channels to gain insights into price volatility, potential overbought and oversold conditions, and trend reversals. When the price touches or breaches the upper or lower bands, it suggests potential trading opportunities. Breakouts from the channel can indicate trend reversals or the continuation of an existing trend.
By monitoring price interactions with the Keltner Channel, traders can make informed decisions regarding entry and exit points, as well as implementing effective risk management strategies. It is essential to consider other technical analysis tools and market factors in conjunction with Keltner Channels for comprehensive trading analysis.
The Importance of Volatility:
Keltner Channels incorporate volatility as a key component in their construction and interpretation. Understanding and utilizing volatility is crucial for Forex traders, as it provides valuable insights into potential trading opportunities and risk assessment.
Keltner Channels use the average true range (ATR) as a measure of price volatility. The ATR calculates the average range between high and low prices over a specified period. By incorporating the ATR into the upper and lower bands, Keltner Channels adapt to changes in volatility, providing a dynamic framework for analyzing price movements.
Volatility indicates the degree of price fluctuation within a given timeframe. High volatility suggests larger price swings, presenting opportunities for capturing substantial profits. On the other hand, low volatility signifies relatively stable price action, indicating a potential consolidation or lack of trading opportunities.
By monitoring the width of the Keltner Channel, traders can identify periods of high and low volatility. When the channel expands, it suggests increased volatility and potentially larger price movements. This expansion may indicate the start of a trending phase or a breakout from a consolidation pattern, providing opportunities for trend-following or breakout trading strategies.
Conversely, a contracting Keltner Channel indicates reduced volatility and a potential period of price consolidation. During such times, price movements are typically smaller, making it challenging to profit from directional trades. Traders may opt for range-bound or mean-reversion strategies, aiming to capitalize on price oscillations within the narrower channel.
Identifying periods of high and low volatility is essential for risk management. During high volatility, the potential for larger price swings increases, requiring wider stop-loss orders to account for the increased risk. In contrast, low volatility may necessitate tighter stop-loss orders to minimize potential losses during price consolidation.
By utilizing Keltner Channels to gauge volatility, traders can align their trading strategies with market conditions. Adapting to varying volatility levels allows traders to capitalize on price movements, manage risk effectively, and make informed decisions when entering or exiting trades.
It is important to note that volatility is just one aspect of market analysis, and traders should consider other technical indicators, fundamental factors, and market sentiment to form a comprehensive trading strategy.
2. Constructing Keltner Channels:
2.1 Selecting the Appropriate Parameters:
Selecting suitable parameters for the Keltner Channels is crucial for their effectiveness in Forex trading. The two main parameters to consider are the exponential moving average (EMA) period and the multiplier used to determine the channel width.
The EMA period determines the sensitivity of the centerline to recent price changes. A shorter EMA period, such as 10 or 14, will react more quickly to price fluctuations, making the channel more responsive to short-term price movements. Conversely, a longer EMA period, such as 20 or 50, will provide a smoother centerline, reflecting a more significant price trend. Traders should consider their trading style, time frame, and the level of responsiveness they desire from the indicator when selecting the EMA period.
The multiplier is used to calculate the width of the upper and lower bands relative to the ATR. It determines the level of volatility required for the channel to expand. A higher multiplier will result in wider bands, capturing more significant price movements. Conversely, a lower multiplier will lead to narrower bands, indicating smaller price fluctuations. Traders need to find a balance that aligns with their risk tolerance and trading strategy. It’s important to note that different market conditions may require adjustments to the multiplier. For example, during high-volatility periods, a smaller multiplier may still capture substantial price movements, while in low-volatility periods, a higher multiplier may be needed to generate meaningful trading signals.
Guidelines for Choosing Optimal Values:
- Time Frame: Consider the time frame you are trading. Shorter time frames, such as intraday or scalping, may benefit from shorter EMA periods and smaller multipliers to capture quick price movements. Longer time frames, such as swing or position trading, may require longer EMA periods and larger multipliers to identify broader trends.
- Market Conditions: Evaluate the prevailing market conditions. Highly volatile markets may require larger multipliers to capture significant price swings, while low-volatility markets may benefit from smaller multipliers to identify smaller price fluctuations.
- Historical Analysis: Conduct historical analysis to backtest various combinations of parameters. Use historical price data to assess the performance of different EMA periods and multipliers in capturing price movements and generating trading signals. Optimize the parameters based on historical results, keeping in mind the need for consistent and robust performance.
- Personal Preference: Ultimately, each trader may have their own preferences and trading style. Experiment with different parameter values and observe how the Keltner Channels align with your analysis and trading decisions. Adjust the parameters based on your comfort level and the performance you observe in real-time trading.
Remember, parameters should not be set in stone. Periodically review and adjust them as market conditions change. The goal is to find a parameter combination that complements your trading strategy, enhances your decision-making process, and provides reliable signals in the context of your chosen time frame and market conditions.
2.2 Plotting Keltner Channels on a Chart:
Adding Keltner Channels to popular Forex trading platforms, such as MetaTrader, is a straightforward process. Here are step-by-step instructions for adding Keltner Channels to a chart using MetaTrader:
Step 1: Open MetaTrader:
Launch the MetaTrader platform on your computer or mobile device. Ensure that you have a chart open for the currency pair you want to analyze.
Step 2: Select the Currency Pair and Time Frame:
In the Market Watch or Navigator window, locate the currency pair you want to analyze. Right-click on it and select “Chart Window” to open a new chart. Choose the desired time frame for analysis.
Step 3: Insert Indicator:
To add the Keltner Channels indicator to the chart, you can follow one of the two methods:
Method 1: From the Navigator window
- Locate the Navigator window (usually on the left-hand side of the screen).
- Expand the “Indicators” section by clicking the small triangle icon.
- Scroll down and find the “Keltner Channels” indicator.
- Left-click and drag the Keltner Channels indicator onto the chart window.
Method 2: Using the Insert menu
- At the top of the MetaTrader platform, navigate to the “Insert” menu.
- Click on “Indicators” to expand the submenu.
- Within the submenu, navigate to “Custom” and then select “Keltner Channels.”
Step 4: Configure the Indicator Parameters:
After adding the Keltner Channels indicator to the chart, a window will appear to allow you to adjust the parameters. You can customize the EMA period and multiplier according to your preferences and trading strategy. Input the desired values and click “OK” to apply the changes.
Step 5: Analyze the Keltner Channels:
Once the Keltner Channels indicator is applied to the chart, you will see the centerline, upper band, and lower band plotted around the price action. Observe how the price interacts with the bands, breaches them, or bounces off them. Analyze the width of the channel to gauge volatility and potential trading opportunities.
Remember to adjust the time frame and parameters as needed based on your analysis and trading style. Additionally, explore the customization options within the indicator properties to change the appearance of the Keltner Channels, such as line colors and styles, to suit your preferences.
By following these steps, you can easily add Keltner Channels to your MetaTrader charts and leverage this powerful tool for your Forex trading analysis.
3. Interpreting Keltner Channels:
3.1 Identifying Overbought and Oversold Conditions:
Keltner Channels can help traders identify potential overbought and oversold conditions in the Forex market. Overbought conditions occur when prices have risen too far and too fast, suggesting a possible reversal or correction. Conversely, oversold conditions occur when prices have declined excessively, indicating a potential rebound or reversal.
The significance of price touching or breaching the upper or lower bands of the Keltner Channels lies in their interpretation as potential overbought or oversold levels. When the price touches or exceeds the upper band, it suggests that the market is overextended to the upside, indicating a possible overbought condition. Similarly, when the price touches or falls below the lower band, it suggests that the market is oversold.
Traders can employ various trading strategies based on these conditions:
Reversal Trading Strategy:
When the price touches or breaches the upper band, signaling an overbought condition, traders may consider initiating short positions or selling opportunities. This strategy assumes that the price is likely to reverse and move downwards. Traders can wait for additional confirmation, such as bearish candlestick patterns or momentum indicators showing signs of weakness, before entering a trade.
Likewise, when the price touches or falls below the lower band, signaling an oversold condition, traders may consider initiating long positions or buying opportunities. This strategy assumes that the price is likely to reverse and move upwards. Traders can wait for confirmation, such as bullish candlestick patterns or momentum indicators showing signs of strength, before entering a trade.
Trend-Following Strategy:
In some cases, price can persistently stay within the Keltner Channel, riding the upper or lower band. This indicates a strong trending market. Traders can adopt a trend-following strategy by entering trades in the direction of the trend when the price consistently stays above or below the centerline or the upper/lower bands. This approach allows traders to ride the trend until signs of a potential reversal or loss of momentum occur.
It is important to note that while overbought and oversold conditions can provide valuable insights, they should not be solely relied upon for trading decisions. Traders should consider other technical indicators, fundamental analysis, and market context to confirm signals and avoid false signals. Risk management techniques, such as setting appropriate stop-loss orders and profit targets, should also be employed to manage potential losses and secure profits.
By using the Keltner Channels to identify overbought and oversold conditions, traders can enhance their decision-making process, capture potential reversals or trend continuations, and align their trades with the underlying market dynamics.
3.2 Identifying Trend Reversals:
Keltner Channels can be effective in identifying potential trend reversals in Forex trading. By monitoring price interactions with the upper and lower bands, traders can gain insights into shifts in market sentiment and the potential exhaustion of the prevailing trend.
Price Breakouts from the Channel:
One of the key indicators of a potential trend reversal is a price breakout from the Keltner Channel. A breakout occurs when the price breaches either the upper or lower band, indicating a significant shift in market dynamics. Breakouts suggest that the prevailing trend may be losing strength or reversing.
When the price breaks above the upper band, it signals a potential trend reversal from a downtrend to an uptrend. Conversely, when the price breaks below the lower band, it suggests a potential reversal from an uptrend to a downtrend. These breakout signals indicate a shift in market sentiment and offer traders an opportunity to enter trades in the direction of the new emerging trend.
Chart Patterns and Candlestick Formations:
To complement the breakout signals from the Keltner Channels, traders can also look for chart patterns and candlestick formations that provide additional confirmation. These patterns and formations can act as signals for potential trend reversals.
For example:
- Double Top/Double Bottom: A double top pattern forms when the price reaches a high point, retraces, and then makes another attempt at the same high level but fails to break it. This pattern suggests a potential reversal from an uptrend to a downtrend. Conversely, a double bottom pattern forms when the price reaches a low point, retraces, and then makes another attempt at the same low level but fails to break it. This pattern suggests a potential reversal from a downtrend to an uptrend.
- Head and Shoulders/Inverse Head and Shoulders: The head and shoulders pattern consists of three peaks, with the middle peak (the head) higher than the other two (the shoulders). This pattern indicates a potential reversal from an uptrend to a downtrend. Conversely, the inverse head and shoulders pattern shows three troughs, with the middle trough lower than the other two. This pattern suggests a potential reversal from a downtrend to an uptrend.
- Engulfing Patterns: Engulfing patterns occur when a candlestick’s body completely engulfs the body of the previous candlestick. A bullish engulfing pattern forms during a downtrend and suggests a potential reversal to an uptrend. Conversely, a bearish engulfing pattern forms during an uptrend and indicates a potential reversal to a downtrend.
- These chart patterns and candlestick formations, when combined with breakout signals from the Keltner Channels, can provide stronger indications of potential trend reversals. Traders should always consider other technical indicators, fundamental analysis, and market context to confirm these signals before making trading decisions.
By utilizing Keltner Channels in conjunction with chart patterns and candlestick formations, traders can enhance their ability to identify potential trend reversals, improve the accuracy of their trading signals, and effectively adapt to changing market conditions.
4. Implementing Keltner Channels in Forex Trading:
4.1 Scalping Strategies:
Keltner Channels can be effective in identifying potential trend reversals in Forex trading. By monitoring price interactions with the upper and lower bands, traders can gain insights into shifts in market sentiment and the potential exhaustion of the prevailing trend.
Price Breakouts from the Channel:
One of the key indicators of a potential trend reversal is a price breakout from the Keltner Channel. A breakout occurs when the price breaches either the upper or lower band, indicating a significant shift in market dynamics. Breakouts suggest that the prevailing trend may be losing strength or reversing.
When the price breaks above the upper band, it signals a potential trend reversal from a downtrend to an uptrend. Conversely, when the price breaks below the lower band, it suggests a potential reversal from an uptrend to a downtrend. These breakout signals indicate a shift in market sentiment and offer traders an opportunity to enter trades in the direction of the new emerging trend.
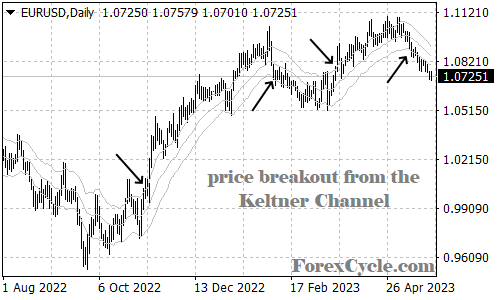
Chart Patterns and Candlestick Formations:
To complement the breakout signals from the Keltner Channels, traders can also look for chart patterns and candlestick formations that provide additional confirmation. These patterns and formations can act as signals for potential trend reversals.
For example:
- Double Top/Double Bottom: A double top pattern forms when the price reaches a high point, retraces, and then makes another attempt at the same high level but fails to break it. This pattern suggests a potential reversal from an uptrend to a downtrend. Conversely, a double bottom pattern forms when the price reaches a low point, retraces, and then makes another attempt at the same low level but fails to break it. This pattern suggests a potential reversal from a downtrend to an uptrend.
- Head and Shoulders/Inverse Head and Shoulders: The head and shoulders pattern consists of three peaks, with the middle peak (the head) higher than the other two (the shoulders). This pattern indicates a potential reversal from an uptrend to a downtrend. Conversely, the inverse head and shoulders pattern shows three troughs, with the middle trough lower than the other two. This pattern suggests a potential reversal from a downtrend to an uptrend.
- Engulfing Patterns: Engulfing patterns occur when a candlestick’s body completely engulfs the body of the previous candlestick. A bullish engulfing pattern forms during a downtrend and suggests a potential reversal to an uptrend. Conversely, a bearish engulfing pattern forms during an uptrend and indicates a potential reversal to a downtrend.
These chart patterns and candlestick formations, when combined with breakout signals from the Keltner Channels, can provide stronger indications of potential trend reversals. Traders should always consider other technical indicators, fundamental analysis, and market context to confirm these signals before making trading decisions.
By utilizing Keltner Channels in conjunction with chart patterns and candlestick formations, traders can enhance their ability to identify potential trend reversals, improve the accuracy of their trading signals, and effectively adapt to changing market conditions.
4.2 Swing Trading Strategies:
Keltner Channels can be a valuable tool for swing traders, as they help capture larger price movements and identify potential trading opportunities. Swing trading aims to capture intermediate-term price swings within an established trend. Here are two strategies that swing traders can employ using Keltner Channels: trading breakouts and trading pullbacks.
Breakout Strategy:
Breakouts occur when the price breaches the upper or lower band of the Keltner Channels, indicating a potential continuation of the prevailing trend or the start of a new trend. Swing traders can take advantage of breakouts by entering trades in the direction of the breakout.
a. Breakout Above the Upper Band:
When the price breaks above the upper band, it suggests a bullish breakout and potential upward momentum. Swing traders can enter a long position, buying the currency pair, and ride the uptrend until signs of a potential reversal or loss of momentum occur. Traders can place a stop-loss order below the breakout candle or a support level and set a profit target based on their risk-reward ratio.
b. Breakout Below the Lower Band:
When the price breaks below the lower band, it suggests a bearish breakout and potential downward momentum. Swing traders can enter a short position, selling the currency pair, and ride the downtrend until signs of a potential reversal or loss of momentum occur. Traders can place a stop-loss order above the breakout candle or a resistance level and set a profit target based on their risk-reward ratio.
Pullback Strategy:
In addition to trading breakouts, swing traders can also utilize pullbacks within the Keltner Channels to enter trades at favorable prices during ongoing trends.
a. Pullback to the Upper Band:
During an uptrend, the price may experience temporary pullbacks towards the centerline or even the lower band of the Keltner Channels. Swing traders can look for these pullbacks as potential buying opportunities. When the price retraces to the upper band and shows signs of resuming the upward trend, traders can enter a long position, anticipating the continuation of the bullish move. Stop-loss orders can be placed below the recent swing low, and profit targets can be set based on the trader’s risk-reward ratio.
b. Pullback to the Lower Band:
During a downtrend, the price may experience temporary pullbacks towards the centerline or even the upper band of the Keltner Channels. Swing traders can monitor these pullbacks as potential selling opportunities. When the price retraces to the lower band and demonstrates signs of resuming the downward trend, traders can enter a short position, anticipating the continuation of the bearish move. Stop-loss orders can be placed above the recent swing high, and profit targets can be set based on the trader’s risk-reward ratio.
It’s important to note that these strategies should be combined with proper risk management techniques, such as setting stop-loss orders and profit targets, to protect capital and maximize potential gains. Additionally, traders should consider other technical indicators, fundamental analysis, and market context to confirm signals and avoid false breakouts or pullbacks.
By using Keltner Channels in swing trading strategies, traders can effectively capture larger price movements, align their trades with the prevailing trend, and capitalize on breakouts or pullbacks within the channel.
4.3 Risk Management and Exit Strategies:
When using Keltner Channels or any trading indicator, it is crucial to implement effective risk management techniques. Risk management helps protect your trading capital and ensures that losses are kept under control. Here are some key considerations for risk management and exit strategies when using Keltner Channels:
Stop-Loss Placement:
Stop-loss orders are essential to limit potential losses in case the trade moves against you. When using Keltner Channels, you can place stop-loss orders outside the channel to allow for price fluctuations while still providing protection.
a. For long positions: Place the stop-loss order below the recent swing low or below a key support level.
b. For short positions: Place the stop-loss order above the recent swing high or above a key resistance level.
By placing the stop-loss orders outside the channel, you provide the trade with some room to breathe while still maintaining a defined risk level.
Profit Targets:
Profit targets are pre-determined levels at which you aim to take profits and close your trades. When using Keltner Channels, you can set profit targets based on various methods, such as:
a. Using the width of the channel: Measure the width of the channel at the beginning of the trade and set a profit target that is a multiple of that width. For example, you can aim for a target that is two or three times the width of the channel.
b. Using key support and resistance levels: Identify significant support and resistance levels on the chart and set profit targets near these levels.
Setting profit targets allows you to secure profits and avoid holding positions for too long, especially when the price reaches potential areas of resistance or support.
Trailing Stop Techniques:
Trailing stops are useful for protecting profits as a trade moves in your favor. Instead of setting a fixed stop-loss order, a trailing stop adjusts dynamically as the price moves in your desired direction. This allows you to lock in profits while still giving the trade room to develop.
a. Using a percentage-based trailing stop: Set a trailing stop order at a certain percentage (e.g., 1% or 2%) below the highest high or above the lowest low since entering the trade.
b. Using a moving average as a trailing stop: Apply a short-term moving average (e.g., 20-period EMA) to the closing prices and trail the stop-loss order along with the moving average.
Trailing stops help protect profits during trending markets, allowing you to stay in winning trades for as long as the trend remains intact.
Remember that risk management techniques should be tailored to your trading style, risk tolerance, and the specific market conditions. It is crucial to stick to your risk management plan consistently and avoid making impulsive decisions based on emotions or market fluctuations.
By implementing effective risk management techniques, such as placing stop-loss orders, setting profit targets, and utilizing trailing stops, traders can mitigate risks, protect capital, and optimize their trading outcomes when using Keltner Channels or any other trading indicator.
5. Backtesting and Optimization:
Backtesting trading strategies using historical data is a crucial step in assessing the viability and profitability of your approach. It allows you to evaluate the performance of your trading strategy under various market conditions and make informed decisions based on historical results. When using Keltner Channels, backtesting can help you determine the effectiveness of different parameter settings and identify the optimal values for specific currency pairs and time frames.
Significance of Backtesting:
a. Performance Evaluation: Backtesting provides insights into the historical performance of your trading strategy, including profitability, drawdowns, and risk-reward ratios. It helps you assess whether the strategy has the potential to generate consistent profits over time.
b. Strategy Refinement: Backtesting allows you to identify potential weaknesses or flaws in your strategy and make necessary adjustments. It helps you refine entry and exit rules, optimize parameter settings, and improve overall strategy performance.
c. Confidence Building: By backtesting and observing positive results, you can gain confidence in your trading strategy, which can enhance discipline and decision-making during live trading.
Optimizing Keltner Channel Parameters:
When optimizing Keltner Channel parameters for specific currency pairs and time frames, consider the following steps:
a. Define Optimization Goals: Clearly define your optimization goals, such as maximizing profitability, minimizing drawdowns, or achieving a specific risk-reward ratio. This will guide your optimization process.
b. Select Parameter Range: Determine the range of values to test for Keltner Channel parameters, such as the EMA period and multiplier. Start with a wide range and gradually narrow it down based on the results.
c. Conduct Iterative Testing: Run backtests with different parameter combinations and evaluate their performance based on your optimization goals. Consider metrics like profit factor, win rate, average trade duration, and maximum drawdown.
d. Analyze Results: Analyze the backtest results to identify the parameter settings that perform best for your desired optimization goals. Look for consistent profitability, robustness across different market conditions, and manageable drawdowns.
e. Validate on Out-of-Sample Data: After identifying potential parameter settings, validate the strategy on out-of-sample data to ensure its performance is not solely based on curve-fitting. This step helps confirm the strategy’s effectiveness in unseen market conditions.
Use of Automated Testing Tools:
To maximize efficiency and accuracy in backtesting and optimization, consider using automated testing tools and strategies. These tools can help you quickly test multiple parameter combinations, generate performance reports, and analyze results.
a. Trading Platforms: Many popular trading platforms, such as MetaTrader, offer built-in backtesting functionalities. These platforms allow you to import historical data, define trading strategies, and perform optimization tests.
b. Algorithmic Trading Platforms: Algorithmic trading platforms, such as Amibroker, QuantConnect, or TradingView, provide advanced backtesting capabilities and allow you to automate the execution of trading strategies.
c. Custom Scripting: If you have programming skills, you can develop custom scripts or algorithms using programming languages like Python or R. These languages offer extensive libraries for backtesting and optimization, giving you more flexibility and customization options.
Automated testing tools enable efficient exploration of parameter combinations, faster iteration of strategies, and objective analysis of results.
It’s important to note that while backtesting and optimization provide valuable insights, they are based on historical data and assumptions. Real-time market conditions may differ, and past performance does not guarantee future results. Regular monitoring, adaptation, and risk management are essential during live trading.
By conducting backtesting, optimizing Keltner Channel parameters, and utilizing automated testing tools, traders can refine their strategies, improve performance, and make more informed decisions when incorporating Keltner Channels into their Forex trading approach.
Conclusion:
Keltner Channels offer valuable insights into Forex trading, allowing traders to gauge volatility, identify potential reversals, and formulate effective trading strategies. By understanding the construction and interpretation of Keltner Channels, traders can integrate this powerful tool into their analysis toolkit and improve their decision-making process in the dynamic Forex market. Remember to thoroughly test and optimize strategies to ensure consistent profitability.