There are several different momentum indicators. One of the popular ones is the RSI (Relative Strength Index) which was developed in 1978 by J. Welles Wilder. The RSI is in the form of an oscillator from 0 to 100. Traditional interpretation suggests RSI of 70 or above signifies overbought condition. Meanwhile, RSI of 30 or below indicates oversold condition. Elliott Wave Theory on the other hand is a different form of technical analysis which was developed much earlier than RSI in 1930s by Ralph Nelson Elliott. It looks at the price patterns and structures to identify investor sentiment and psychology and forecast the future path. The theory identifies 5 waves impulse which sets up the trend. Corrective waves that oppose the larger trend on the other hand develop in 3 waves. Since Elliott Wave Theory is older than the RSI, there is no linkage between the two different methods in the original usage.
As one of the leading service providers, Elliott Wave Forecast (EWF) finds a different way to use RSI with Elliott Wave. We don’t use it to identify overbought or oversold condition. These are the guidelines we use on RSI at EWF and how they will have different conclusion to the traditional understanding:
- Wave 3 in Elliott Wave Theory typically is the strongest wave. In a bullish market, RSI of wave 3 often continues to stay at an overbought region (>70). A traditional understanding of RSI suggests if RSI is over 70, it is overbought and thus traders might sell it. However, we do not recommend selling wave 3. In fact, an extended period of RSI above 70 signals that the trend is in that direction and thus it’s better to buy the dips rather than trying to pick the top and sell.
- Wave 5 in Elliott Wave Theory typically comes with momentum divergence. In a bullish market, this means price makes a higher high while momentum (RSI) makes a lower high. With the traditional understanding, momentum divergence suggests it’s bearish and instrument can selloff. In our view however, a momentum divergence in an uptrend suggests the prevailing trend is bullish as divergence occurs in wave 5 and a 5 waves structure defines the trend’s direction. Thus, even though instrument can do 3 waves pullback after the end of wave 5, if the prevailing trend is bullish, it’s better to buy the dips rather than picking the top and selling wave 5.
- A divergence also happens in the fifth swing of a 7 swing structure. A 7 swing structure is called a double correction or WXY. Sometimes people call it a double zigzag if the internal of wave W and Y happen to be both a zigzag. In a 7 swing double three structure, the fifth swing should come with a divergence like the graph below shows:
Double Three Structure
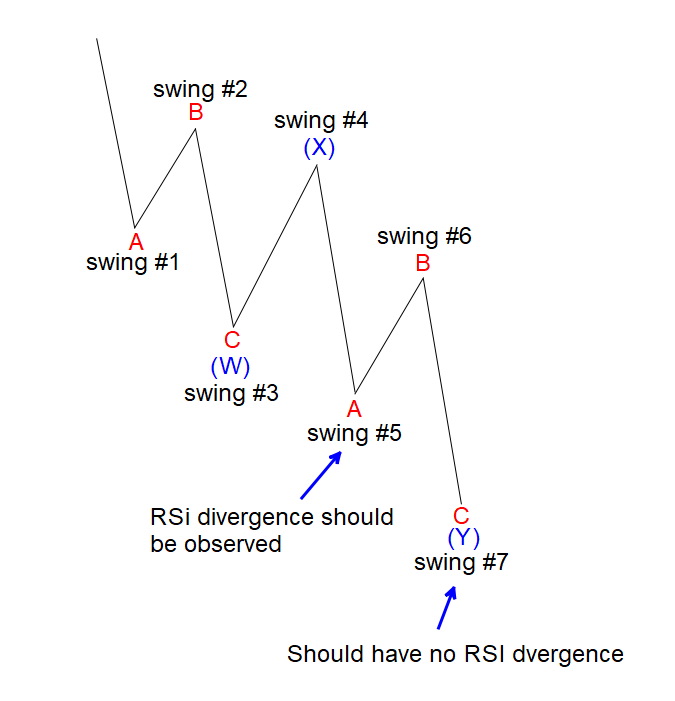
As the graph above shows, when the structure forms a 5 swing lower, swing #5 should come with momentum divergence. In other words, at that point, price makes lower low, but RSI makes a higher low. In the traditional interpretation, a momentum divergence like this signals it’s bullish. Even though it’s partially true that we expect instrument to rally in swing #6, but the fact there’s a divergence in swing #5 suggests the prevailing trend is not complete yet to the downside. Thus instead of trying to buy the divergence, it’ll be better to sell the rally as the prevailing trend in this case is to the downside to end 7 swing structure. Every corrective structure, whether it’s a 3 swing ABC, or 7 swing WXY, per guideline, normally ends without a divergence.
At EWF, we use RSI divergence to check if instrument is in wave 5. We also use it to check if the structure is an incomplete 7 swing structure. For example, if an instrument erases divergence, then that can lead us to switch the count and no longer calling it to be wave 5. An instrument in this case can be still in wave 3 with extended wave 3 or a nest. These are just some of the ways we use RSI with Elliott Wave.
Source: https://elliottwave-forecast.com/elliottwave/how-momentum-indicator-is-used-with-elliott-wave/