GPN is approaching a key Fibonacci support zone, signaling the potential end of a multi-year correction and the start of a new bullish cycle.
Global Payments Inc. (NYSE: GPN) is nearing the end of a long-term correction. According to the weekly Elliott Wave chart, GPN is completing a complex W-X-Y corrective structure in wave ((II)). The price is now approaching a key Fibonacci support zone between $58.75 and $33.95, shown as a blue box on the chart.
The stock completed a major bullish cycle from the early 2000s to 2021, ending with wave (I) at the top. Since then, the price has been correcting in a multi-year decline. The correction has formed a clear W-X-Y pattern, common in Elliott Wave theory.
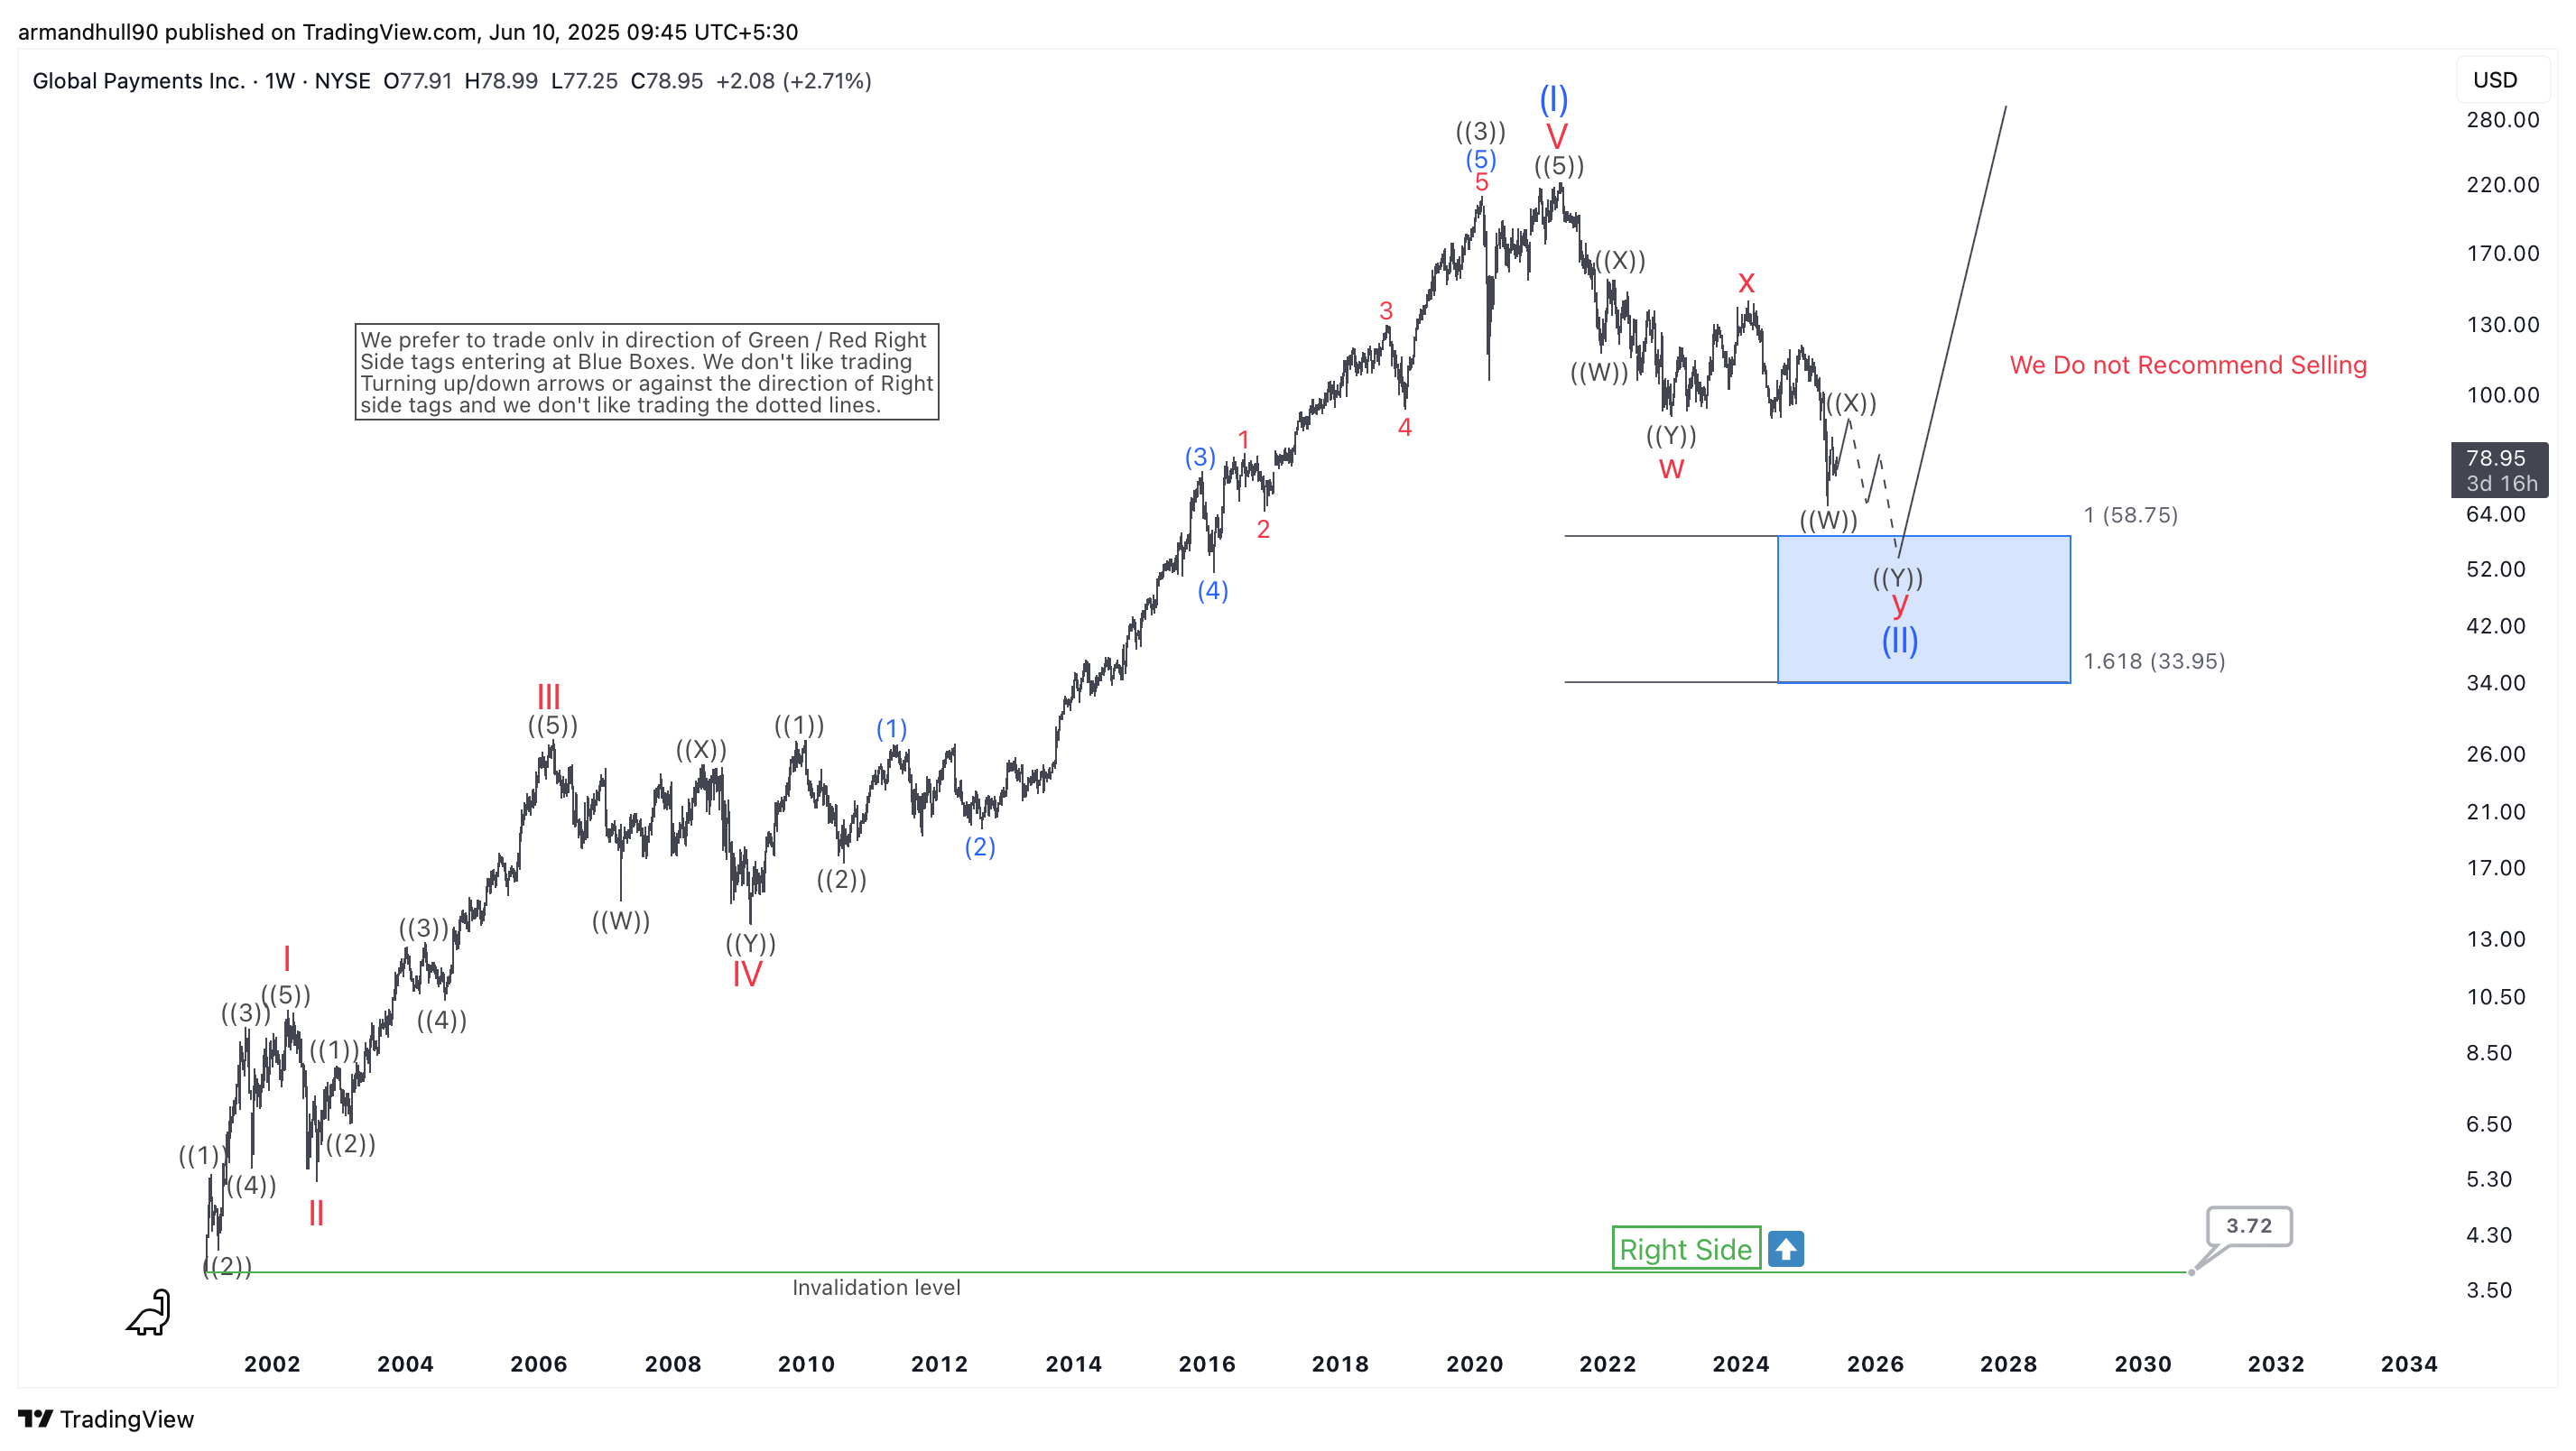
The current zone offers a high-probability area for a bullish reversal. This region is based on Fibonacci extension levels, where many corrections usually end. The chart shows a “Right Side” tag pointing upward, suggesting the next trend is likely bullish. A warning label also says, “We Do Not Recommend Selling,” signaling that traders should avoid short positions.
If the price reacts from the support zone and stays above the invalidation level at $3.72, it will confirm the end of wave ((II)). This could start wave ((III)), which typically brings strong gains. The risk-reward setup favors bullish trades from this zone.
Conclusion:
In conclusion, Global Payments Inc. is likely near the end of a deep and prolonged correction. As it enters the key support zone, traders and investors should watch for bullish confirmation signals. The long-term outlook remains positive, and the current decline presents a possible buying opportunity for trend-following traders.
Source: https://elliottwave-forecast.com/stock-market/global-payments-inc-gpn-weekly-elliott-wave-analysis/