
Microsoft (MSFT) has demonstrated remarkable resilience, fully recovering from losses incurred during the tariff war sell-off. The stock has even achieved a new all-time high. This performance underscores the stock’s persistent bullish trend. The low recorded on April 7, 2025 likely serves as a robust support level during future pullbacks. The rally from this low is unfolding as a classic five-wave impulse pattern, indicative of strong upward momentum, with wave (3) nearing completion.
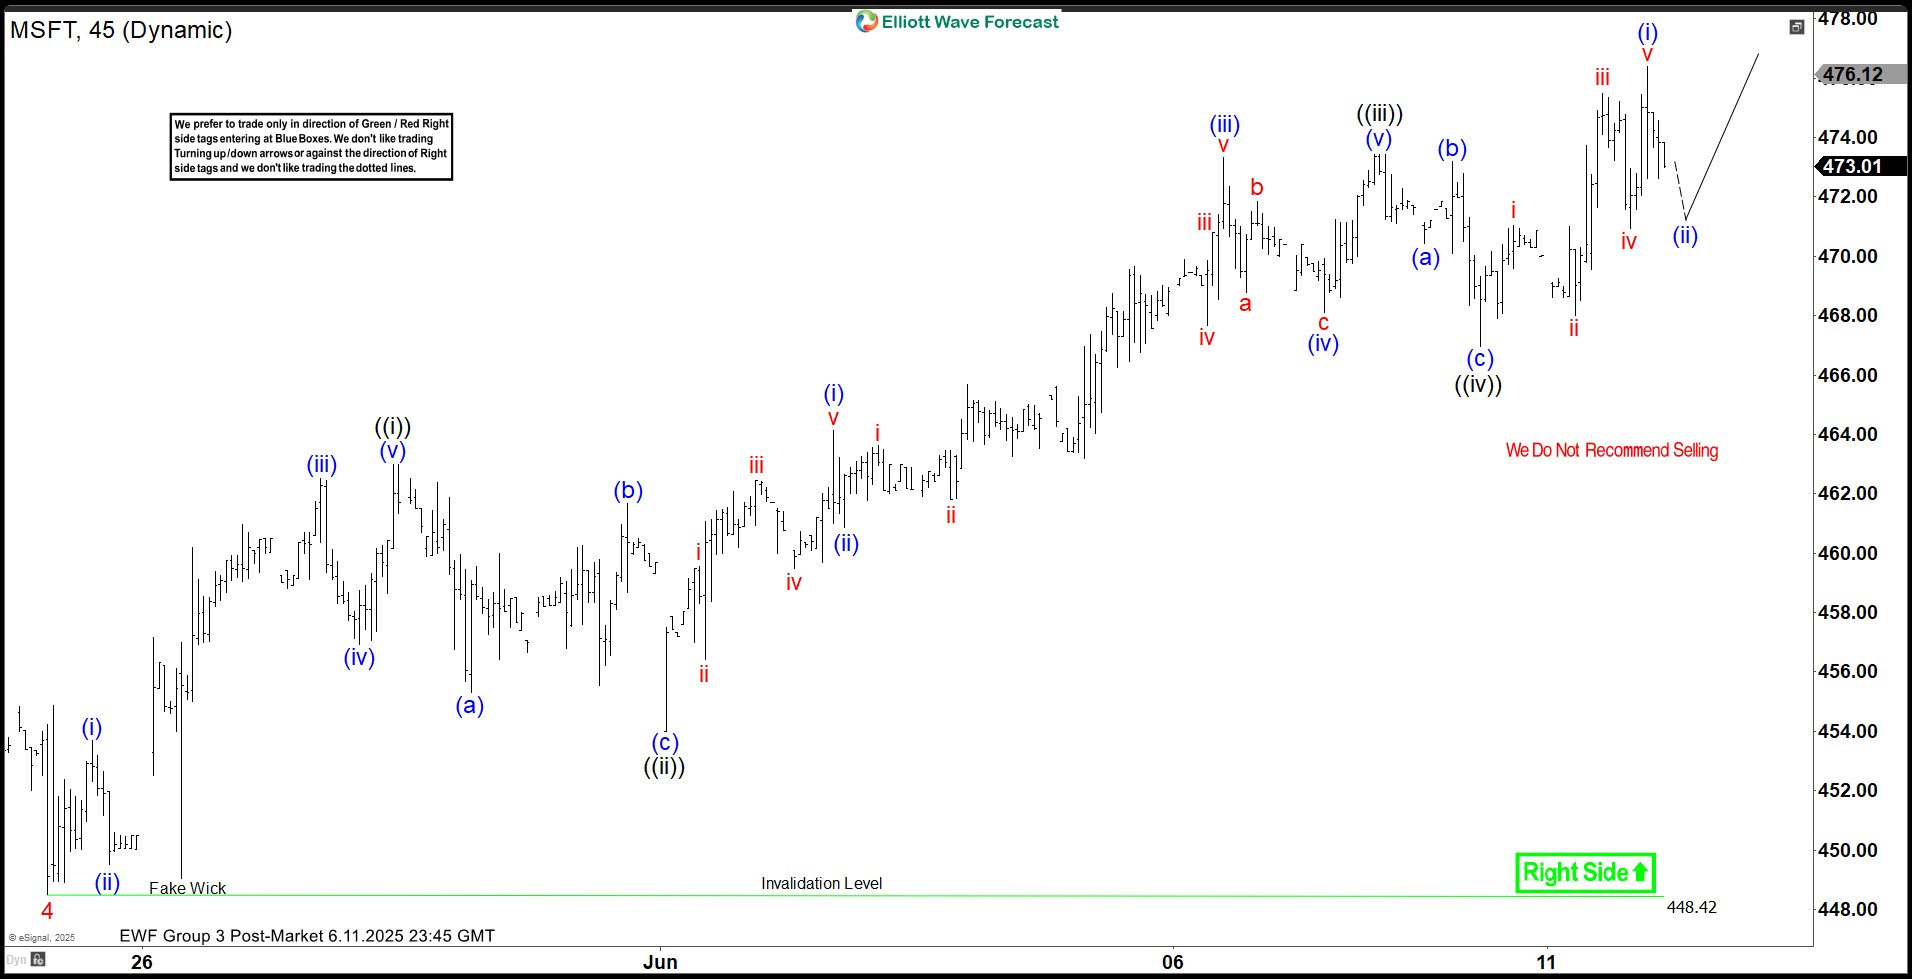
From the April 7 low, wave (1) concluded at 394.65, followed by a pullback in wave (2) that bottomed at 355.67. Wave (3) has since extended higher, exhibiting its own internal impulse structure. Within wave (3), wave 1 peaked at 380.39, with wave 2 dipping to 375.19. The stock then surged in wave 3 to 459.58, followed by a wave 4 retracement ending at 448.91. A detailed 45-minute chart below highlights the final leg wave 5, which further subdivides into a lesser-degree impulse. From wave 4, wave ((i)) reached 463 and wave ((ii)) corrected to 454. Wave ((iii)) climbed to 473.43, and wave ((iv)) dipped to 466.96.
MSFT may experience a slight further upside to complete wave ((v)) of 5 of (3). However, a larger-degree pullback in wave (4) is anticipated soon, setting the stage for one final upward push to conclude the five-wave rally from the April 7 low. This structured advance reinforces Microsoft’s bullish outlook, with key support levels likely to hold firm.
Microsoft (MSFT) 45-Minute Elliott Wave Technical Chart