
Hello traders. In this technical article we’re going to look at the Elliott Wave charts of GBPUSD forex pair published in members area of the website. The pair recently delivered an intraday pullback and, as anticipated, attracted buyers precisely at the Equal Legs area. In the analysis below, we’ll break down the Elliott Wave count and highlight the key target zones for the next leg higher.
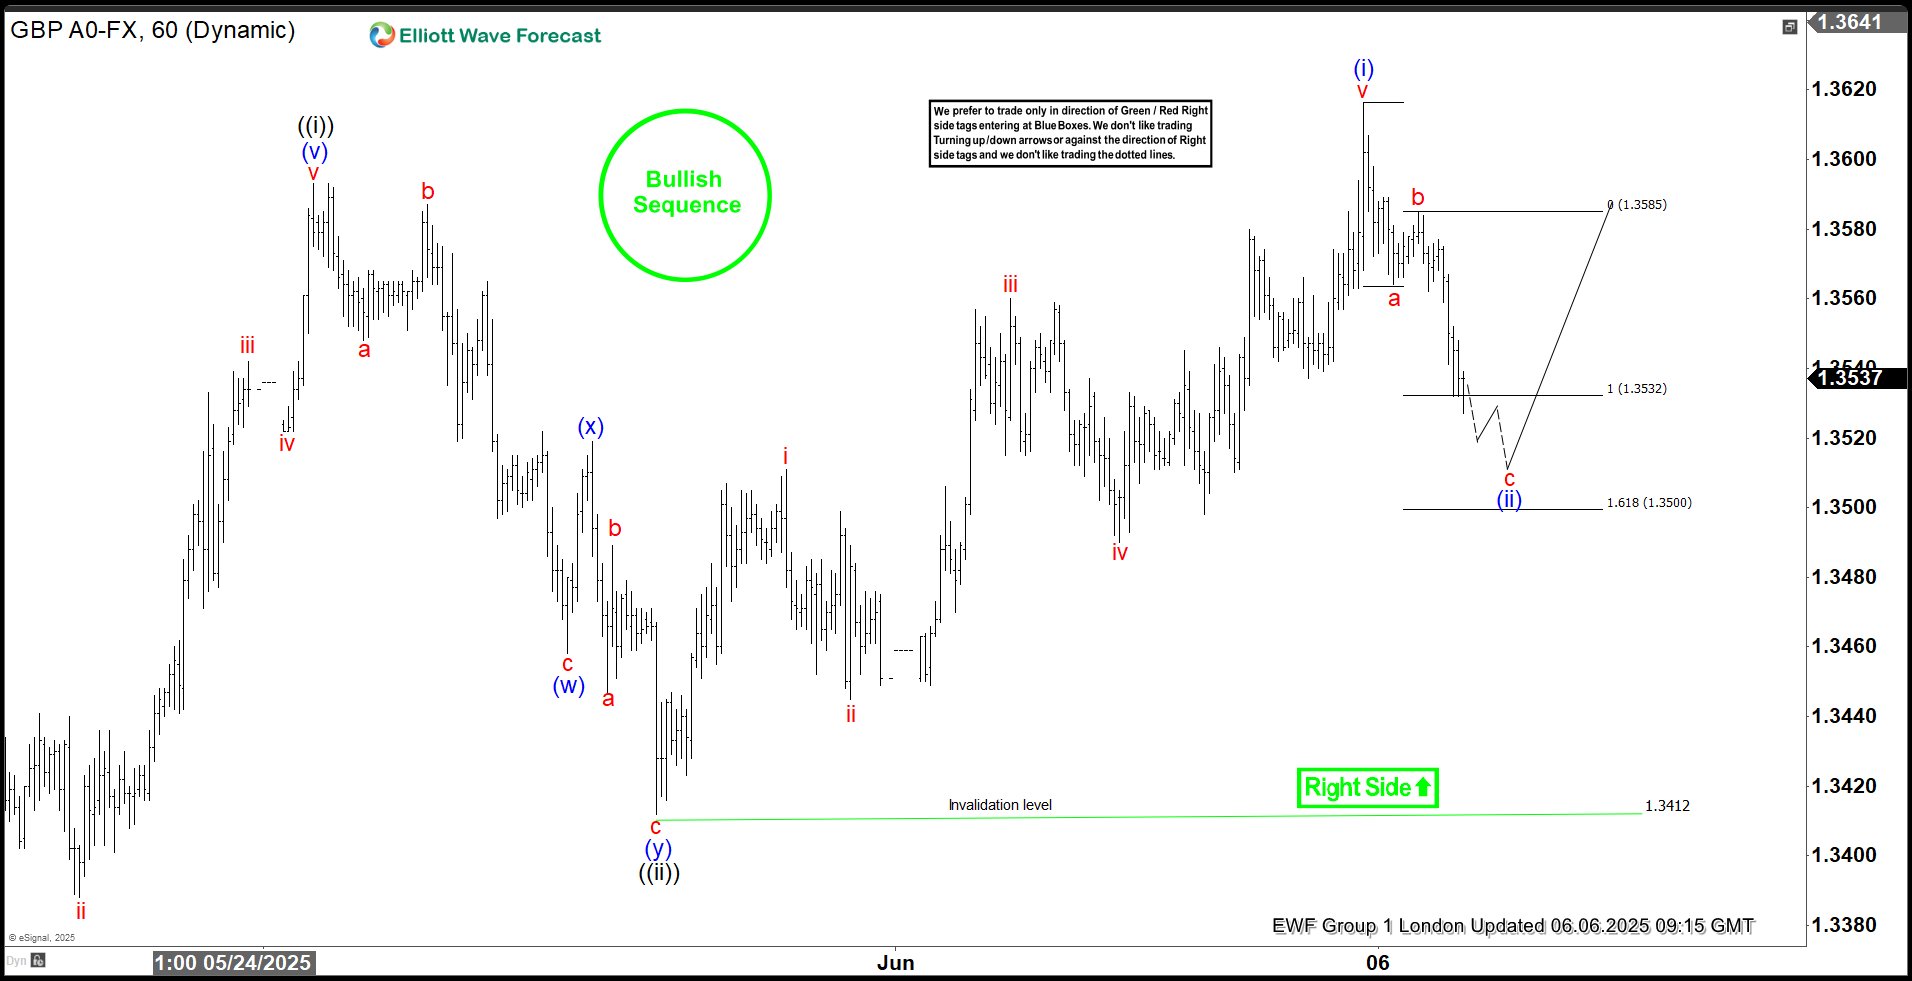
GBPUSD Elliott Wave 1 Hour Chart 06.06.2025
GBP/USD is currently forming an intraday three-wave pullback from recent highs. Our members understand how to identify potential reversal zones using the Equal Legs technique: a related to b red . So, in this case, the ideal support area lies between 1.3532 and 1.3500. While additional near-term downside remains possible, as long as price stays within this zone, we expect buyers to emerge and continuation of the bullish trend to resume.
90% of traders fail because they don’t understand market patterns. Are you in the top 10%? Test yourself with this advanced Elliott Wave Test
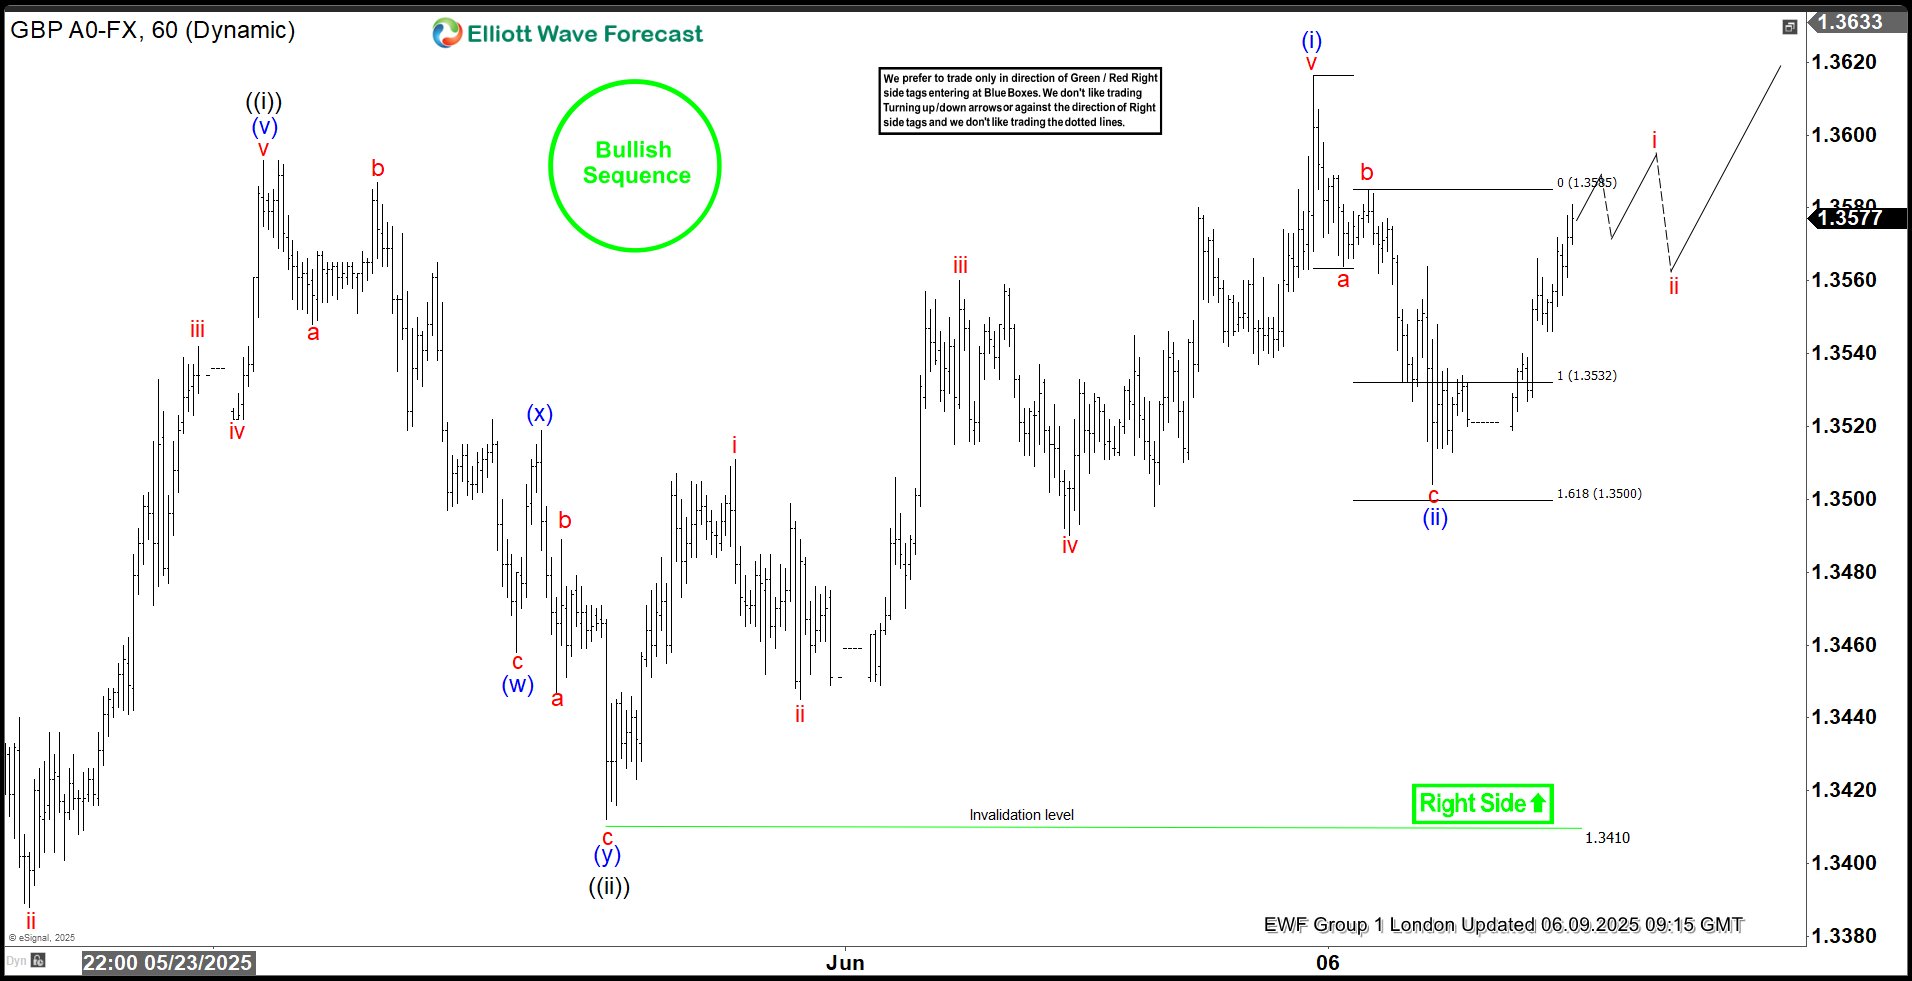
GBPUSD Elliott Wave 1 Hour Chart 06.06.2025
The pair has found buyers in the marked area, as expected. GBPUSD has since staged a solid rally from this support area. At this point, we do not recommend initiating short positions. The key short-term support level to watch is 1.35069—maintaining price above this level supports the case for the next upward leg. While above the mentioned low, the pair can see extension toward 1.3708 area. To confirm the continuation of the rally, we want to see a decisive break above the previous (i) blue peak.
Reminder for members: Our chat rooms in the membership area are available 24 hours a day, providing expert insights on market trends and Elliott Wave analysis. Don’t hesitate to reach out with any questions about the market, Elliott Wave patterns, or technical analysis. We’re here to help.
Source: https://elliottwave-forecast.com/forex/gbpusd-elliott-wave-forecasting-rally/