Gold Miners Junior (ticker: GDXJ) spent the past two years in a deep correction, but it looks to have found the bottom on 9.26.2022 low at 25.80 as the second chart (the Daily chart) below shows. The rally from 9.26.2022 low is in 5 waves (impulsive), suggesting that the bottom is likely in place and it’s ready to rally higher. This sets up the ETF to perform very well in coming months and years as the monthly chart below shows. We use Elliott Wave to analyze the potential path.
GDXJ Monthly Elliott Wave View
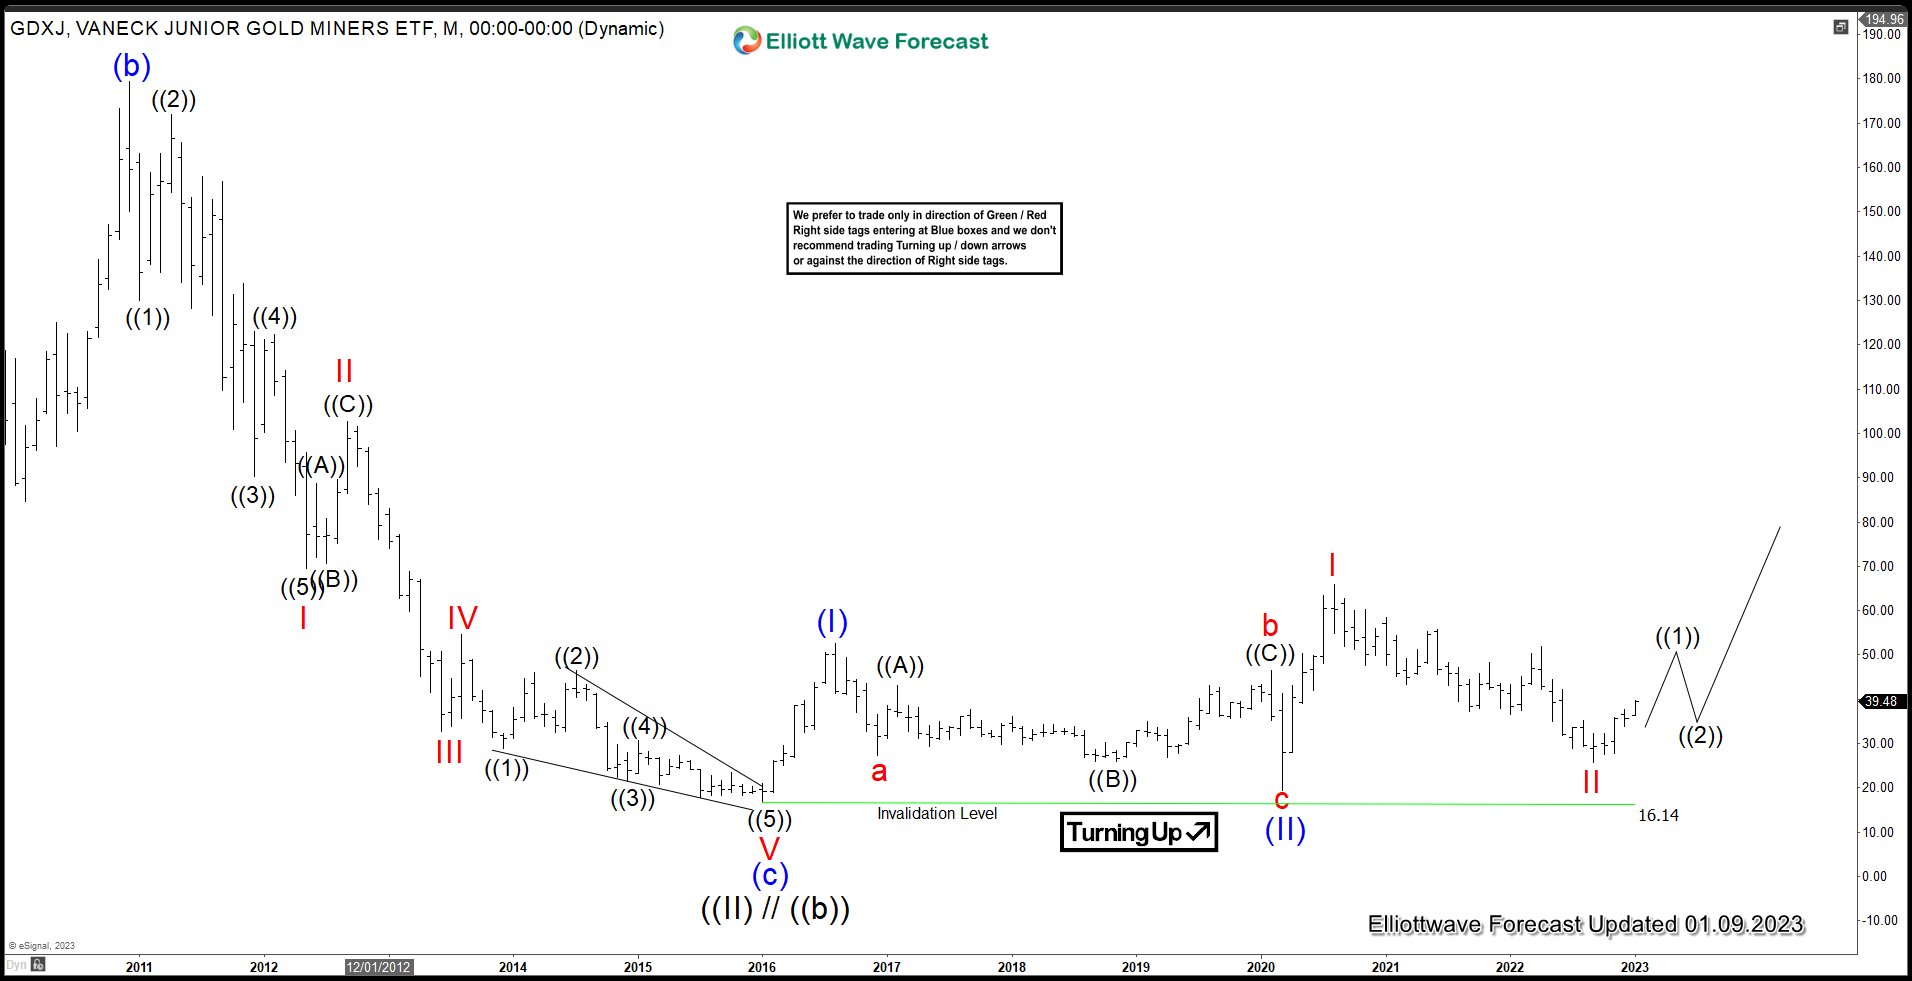
Monthly Elliott Wave chart of GDXJ suggests the ETF bottomed on January 2016 low at 16.14 as wave ((II)). The instrument then rally higher as a nest. Up from wave ((II)), wave (I) ended at 52.5 and pullback in wave (II) ended at 19.52. Gold Miners Junior ETF then extends higher again in wave I of (III) towards 65.95 and pullback in wave II ended at 25.80. While dips continue to stay above January 2016 low, expect the ETF to continue to extend higher.
GDXJ Daily Elliott Wave View
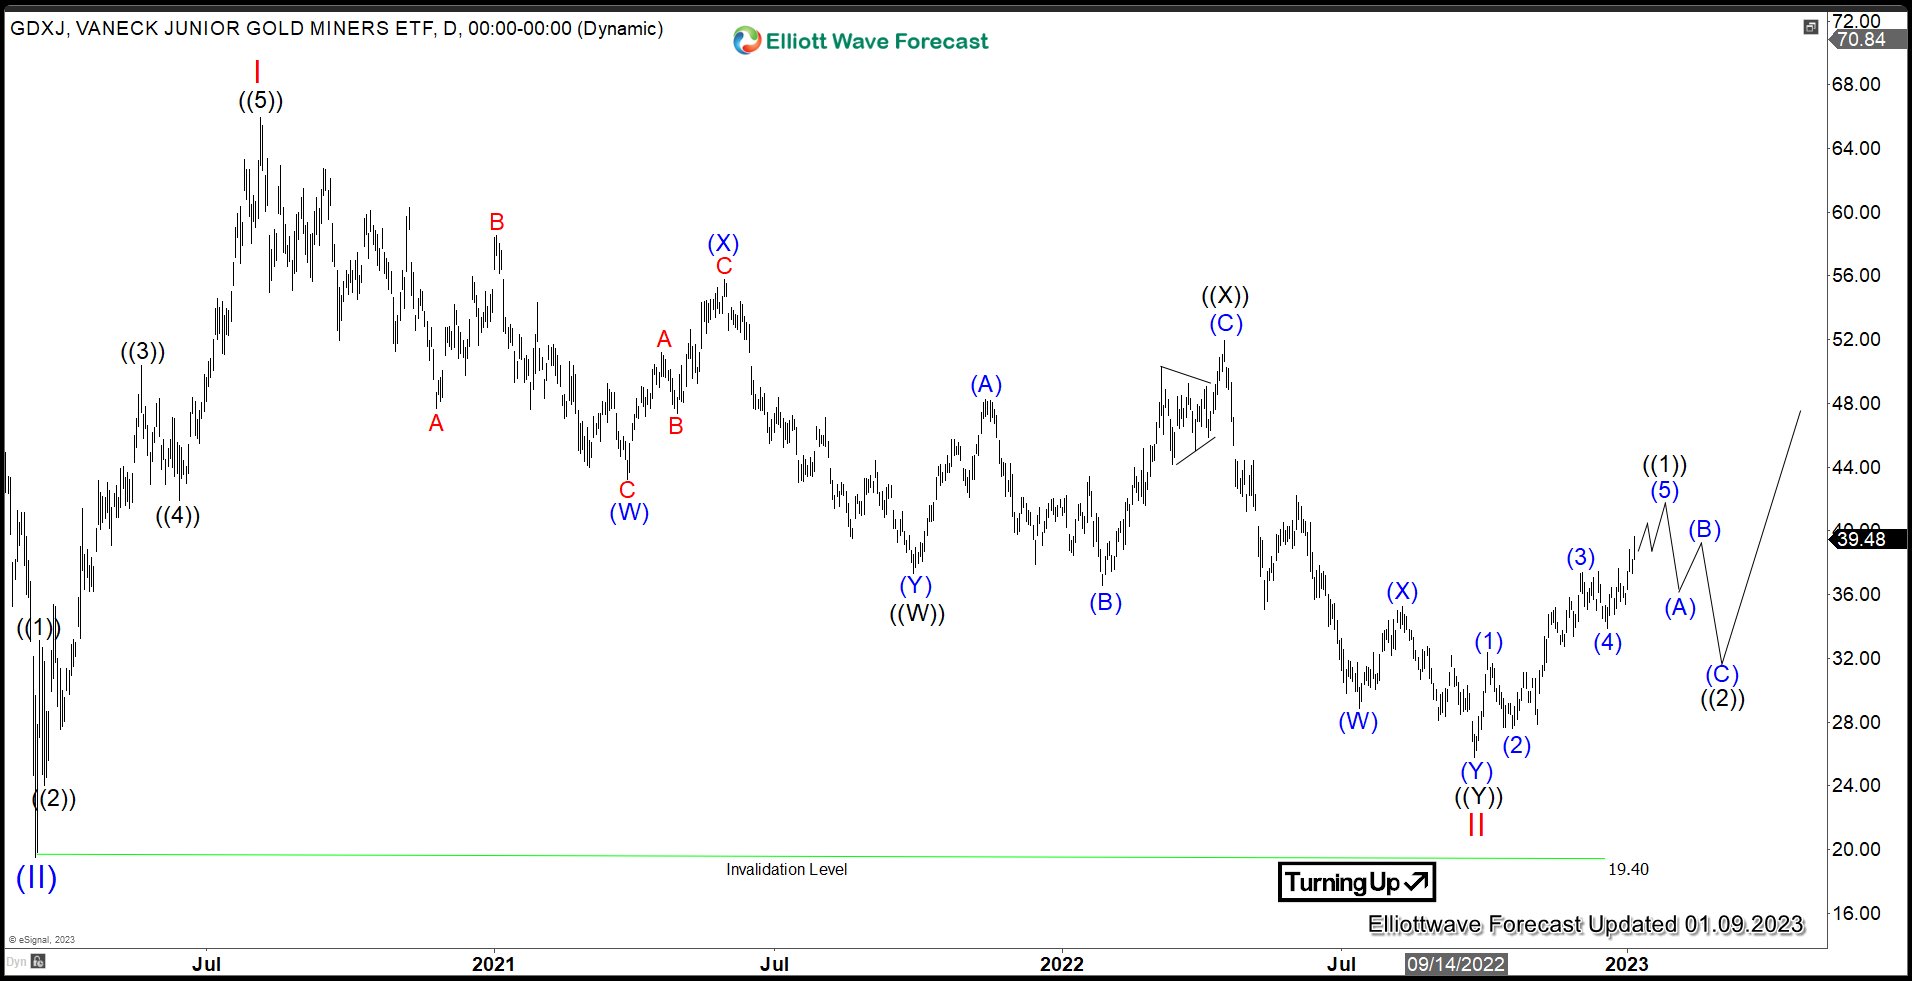
Daily Elliott Wave Chart of GDXJ above shows wave (II) ended at 19.40. Wave (III) rally has started with internal subdivision as another 5 waves. Up from wave (II), wave I ended at 65.95 and dips in wave II ended at 25.80. The rally from there is impulsive suggesting the next bullish leg has started. Up from wave II, wave (1) ended at 32.34, and wave (2) ended at 28.45. The ETF extends higher again in wave (3) towards 37.41 and wave (4) ended at 33.89. Expect wave (5) of ((1)) to end with a few more high. Afterwards, it should pullback in wave ((2)) to correct cycle from 9.26.2022 low before the rally resumes higher.
Source: https://elliottwave-forecast.com/stock-market/five-waves-rally-gdxj-suggests-bottom-place/