
Johnson & Johnson (JNJ) is an American multinational corporation founded in 1886 that develops medical devices, pharmaceuticals, and consumer packaged goods. Its common stock is a component of the Dow Jones Industrial Average, and the company is ranked No. 36 on the 2021 Fortune 500 list of the largest United States corporations by total revenue. Johnson & Johnson is one of the world’s most valuable companies and is one of only two U.S.-based companies that has a prime credit rating of AAA, higher than that of the United States government.
JNJ August 2022 Daily Chart
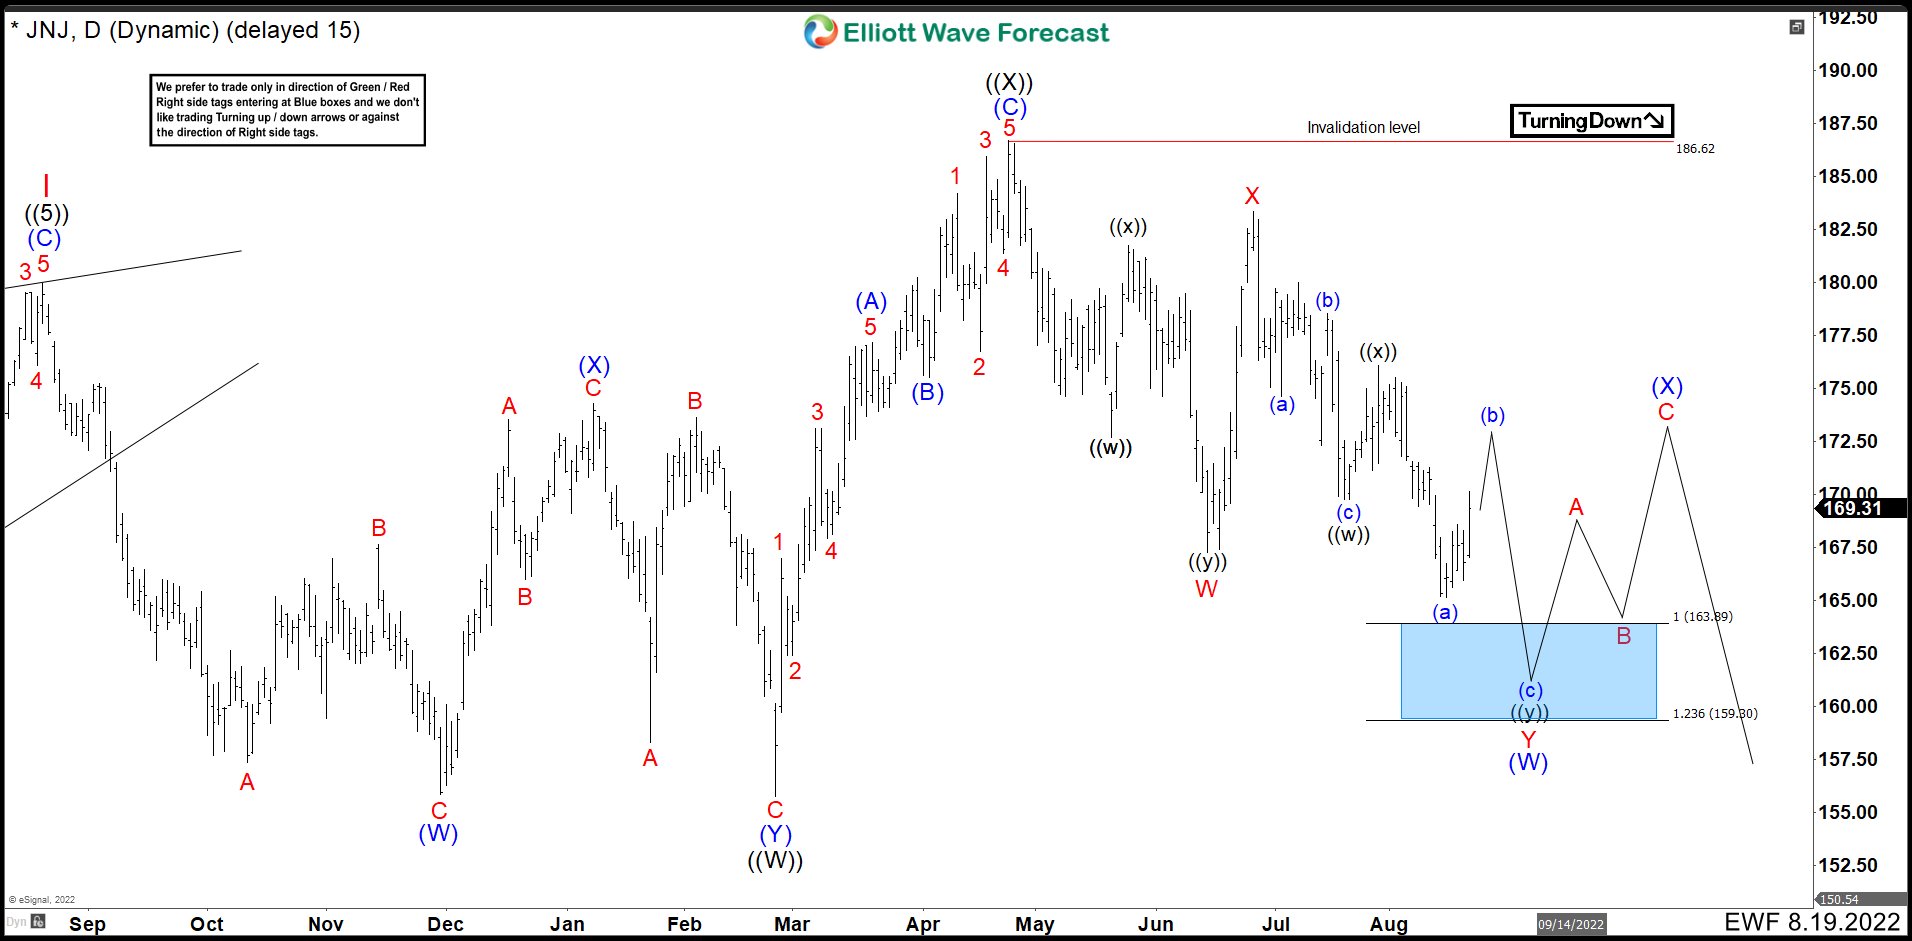
After JNJ ended wave I cycle we believe that wave II is doing a double correction. The first wave ((W)) did a double correction from 179.92 to end at 155.71. Then rally to 186.62, we labeled as a zig zag correction as wave ((X)). Currently we are developing wave ((Y)) and the structure shows that the best count is as a double correction. Down from 4/25/2022 high, we could see 7 swings lower completing wave W at 167.26. A strong bounce ended wave X at 183.41. We were looking for another 7 swings correction lower to complete (W) in the blue box area in 163.89 – 159.30. Then, we expected at least 3 swings higher as wave (X) before continue lower. (If you want to learn more about Elliott Wave Theory, please follow these links: Elliott Wave Education and Elliott Wave Theory).
JNJ January 2023 Daily Chart
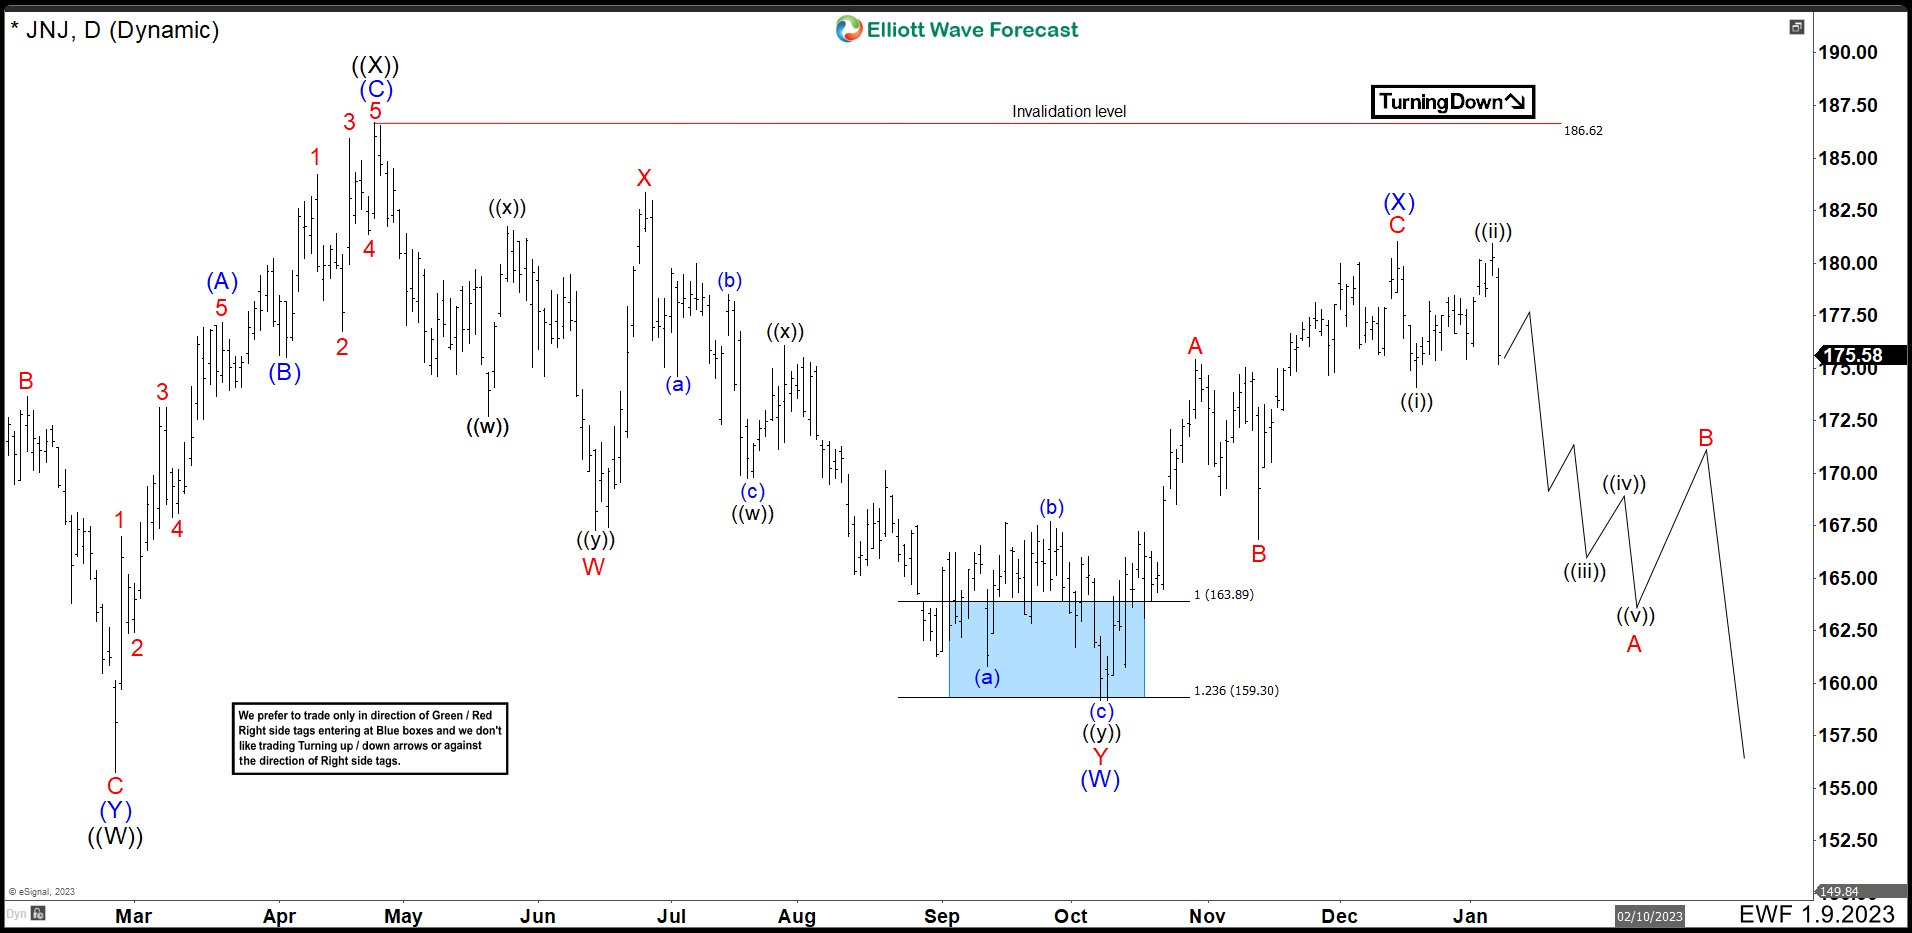
Wave (W) ended just below the blue box at 159.17 and bounced sharply. Wave A ended at 175.39. Then, we saw 3 swings lower and ended wave B at 166.75. From here, another impulse took place to complete wave C and wave (X) at 180.04. As long as JNJ price remains below 186.62, we expect more bearish movement to break the low of the wave (W). In the near term, we believe that wave ((i)) and ((ii)) have ended and we should see a bullish consolidation before continuing lower.