In this blog, we are going to take a look at the Elliott Wave chart of AUDJPY. The Daily chart update below shows that the pair has continued to extend higher from March 19, 2020 low. The rally is proposed to be unfolding as a double three Elliott Wave Structure. Up from March 19 low, the pair ended wave A at 65.63 high. The pullback in wave B ended at 62.80 low. Wave C then ended at 70.17 high. This ended wave (W) in the larger degree. Afterwards, the pair did a pullback in wave (X), which ended at 67.63 low.
AUDJPY Daily Elliott Wave Chart
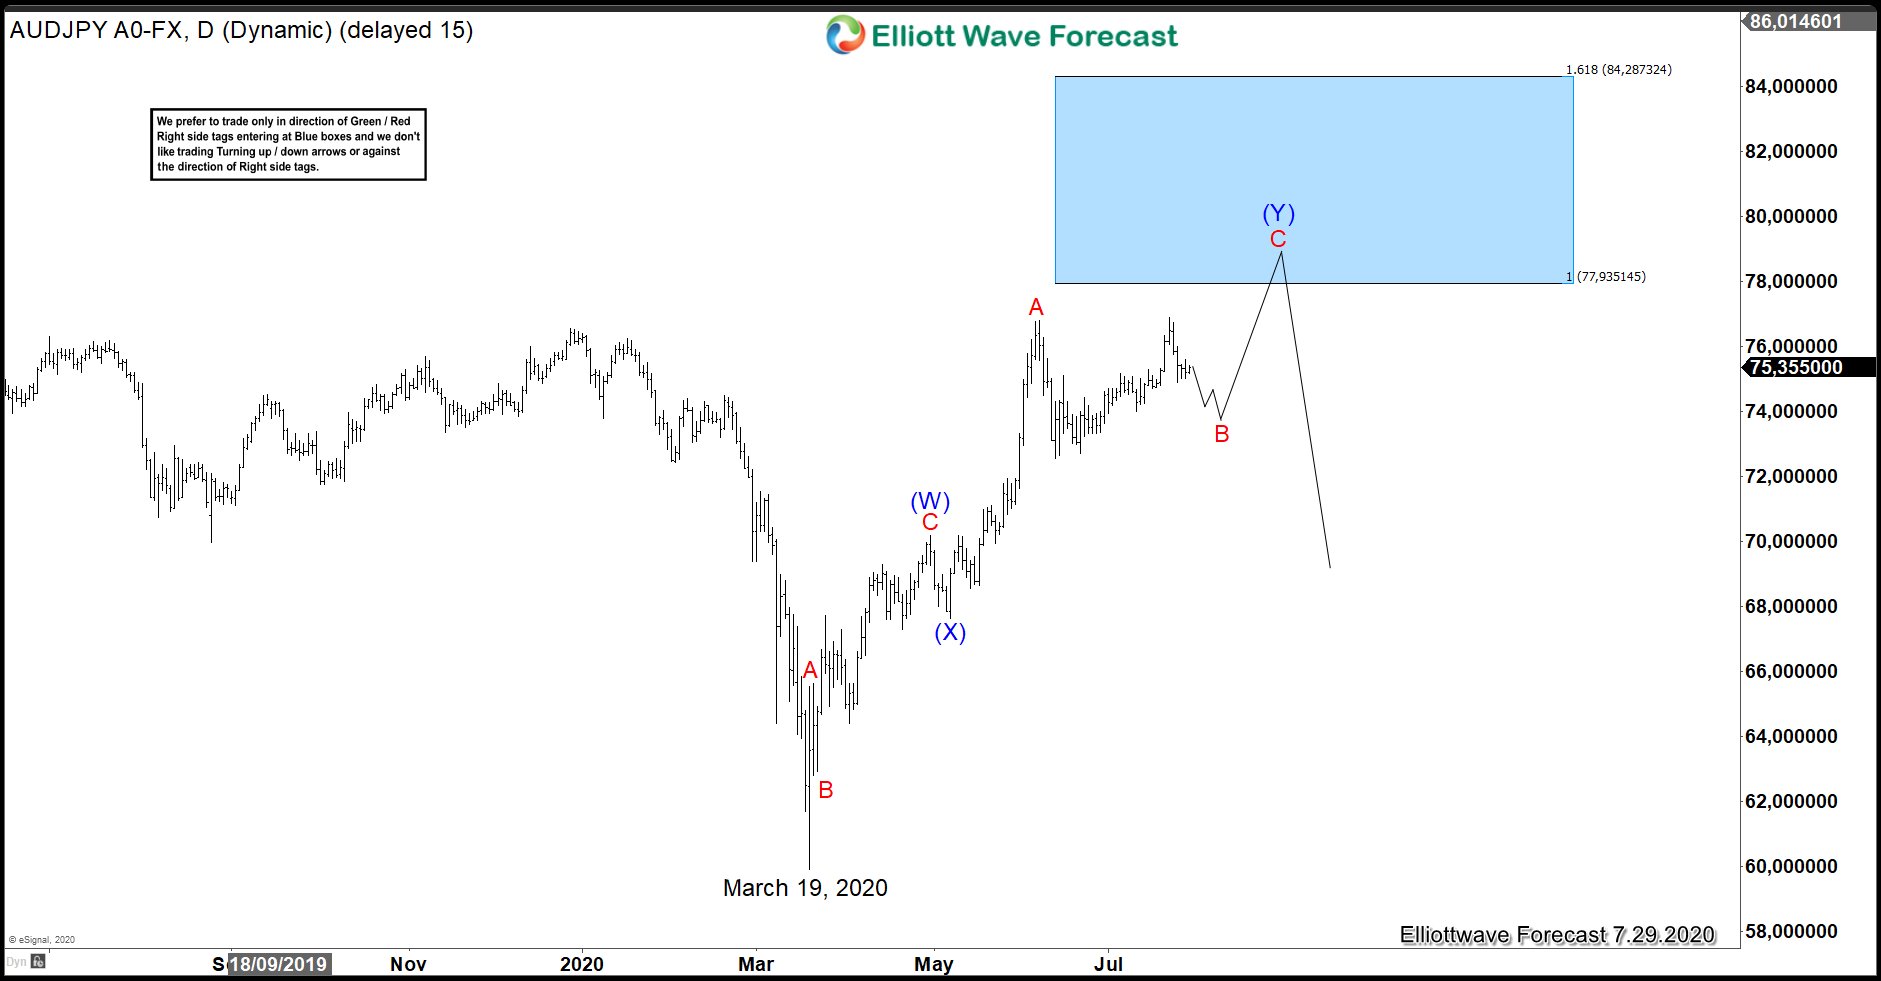
From wave (X) low, the pair has extended higher in wave A, which ended at 76.79 high. The rally higher has broken above previous wave (W) high. This confirms that the next leg higher in wave (Y) is already in progress. The 100% – 161.8% extension of wave (W)-(X) where (Y) can potentially end is between 77.93-84.28 area.
AUDJPY 7.28.2020 4 Hour Elliott Wave Chart
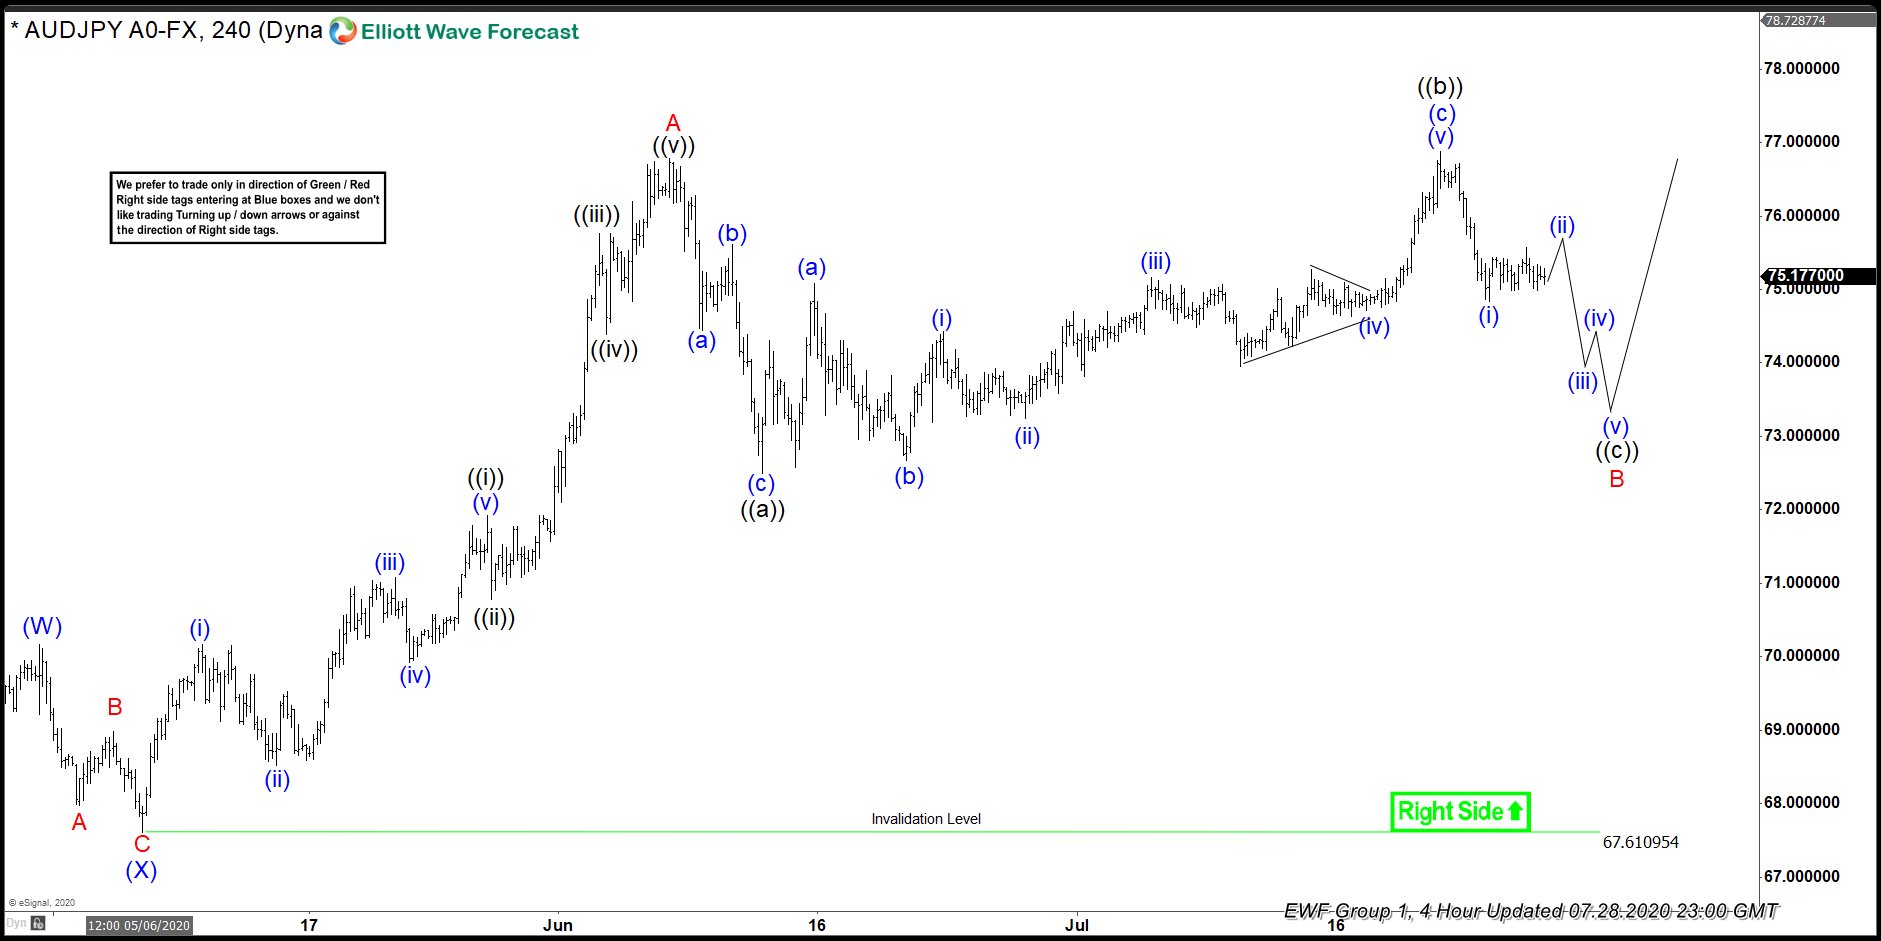
The 4 hour chart from July 28 shows that the rally in wave A unfolded as 5 waves impulse Elliott Wave Structure. Currently, the pullback in wave B remains in progress and is unfolding as a flat correction. As long as the low at 67.61 stays intact, the pullback in 3,7, or 11 swing is expected to find support for further upside to allow the pair to reach the equal leg area in the Daily chart.