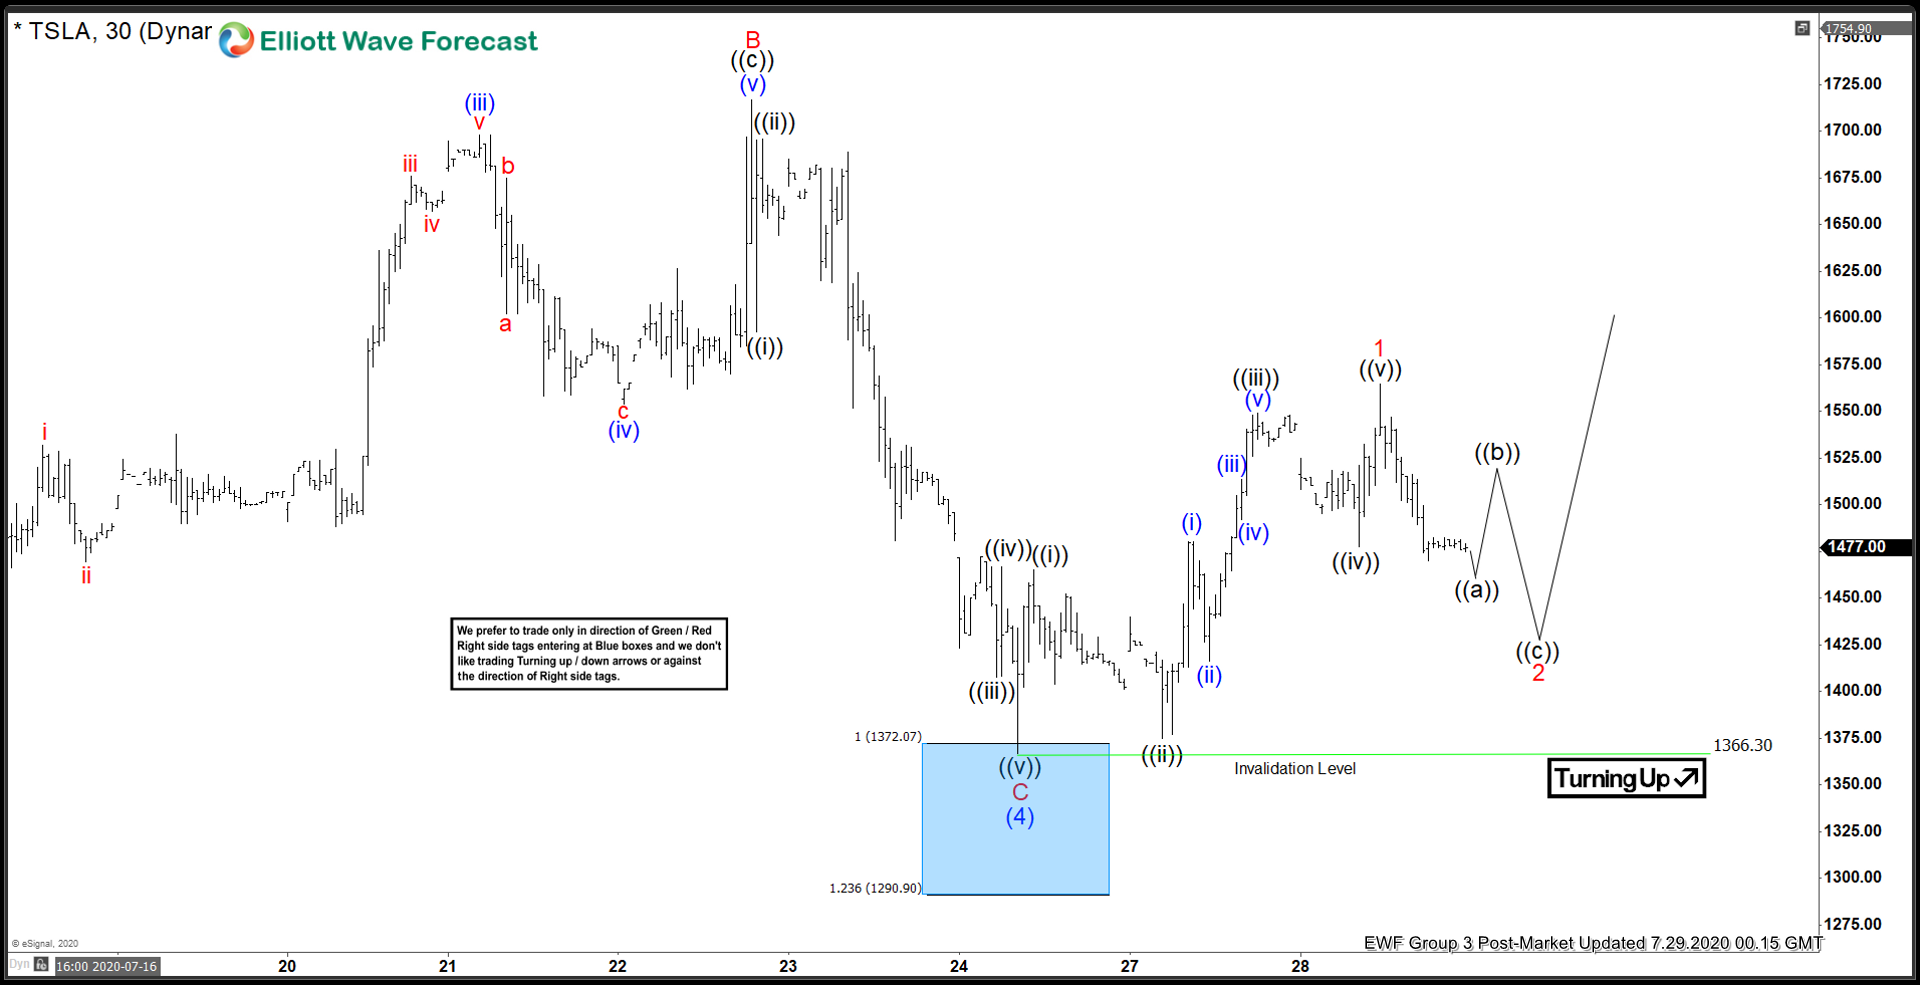
Tesla (TSLA) 30 minutes chart below shows that the stock has ended the correction from July 13 peak. The decline unfolded as a zig-zag Elliott Wave Structure. From July 13 high, wave A ended at 1450 low. The bounce in wave B ended at 1716.47 high. The stock then extended lower in wave C, which ended at 1366.30 low. This completed wave (4) in larger degree. The correction reached the blue box area, which is the 100 – 123.6% extension of wave A-B. From that blue box, the stock has turned higher. This allows buyers at blue box a risk free position.
Up from wave (4) low, the stock rallied higher in wave 1. The subdivision unfolded as 5 waves impulse Elliott Wave Structure. Wave ((i)) ended at 1465 high and the pullback in wave ((ii)) ended at 1375 low. Afterwards, the stock resumed higher in wave ((iii)), which ended at 1549 high. Wave ((iv)) dips then ended at 1477.60 low. The final push higher in wave ((v)) ended at 1564.70 high. Currently, wave 2 pullback to correct the cycle from July 24 is in progress. As long as 1366.30 low stays intact, the dips in 3,7 or 11 swings is expected to find support for more upside. However, TSLA still needs to break above July 13 high to confirm that the next leg higher has started. Otherwise, the stock can still do a double zig-zag correction in wave (4) before resuming higher again later.
Tesla (TSLA) 30 Minutes Elliott Wave Chart