
Zoom Video Communications Inc (NASDAQ: ZM) is an American remote conferencing services company that combines video conferencing, online meetings, chat, and mobile collaboration.
The stock has gained 90% since February before giving up half of the gains last week , while the majority of stocks has plunged over 20%. That puts ZM as one of the favored stocks during this pandemic as people across the world are stuck indoors with the spreads of Corona virus and they’re turning to video calls to chat with friends, family members, colleagues, classmates and customers. and there are any number of free services. Unlike other Apps, Zoom is available on IOS, Android and on any laptop and anyone can use it because it’s free.
The recent popularity of the Zoom made investors jump into the stock to use it as a hedge to their bleeding portfolio, but is still the right time to buy it ?
Looking at the Elliott Wave Structure of the stock from last year, ZM established an impulsive rally since IPO last year which is looking to unfold either as a bullish nest or a simple 5 waves advance. The nest scenario which we’ll discuss in this article is the most bullish scenario at this stage suggesting that current correction is wave II of (III) which indicates that Zoom is still in the early stage of a bullish trend.
Looking at the current correction we can define 2 paths:
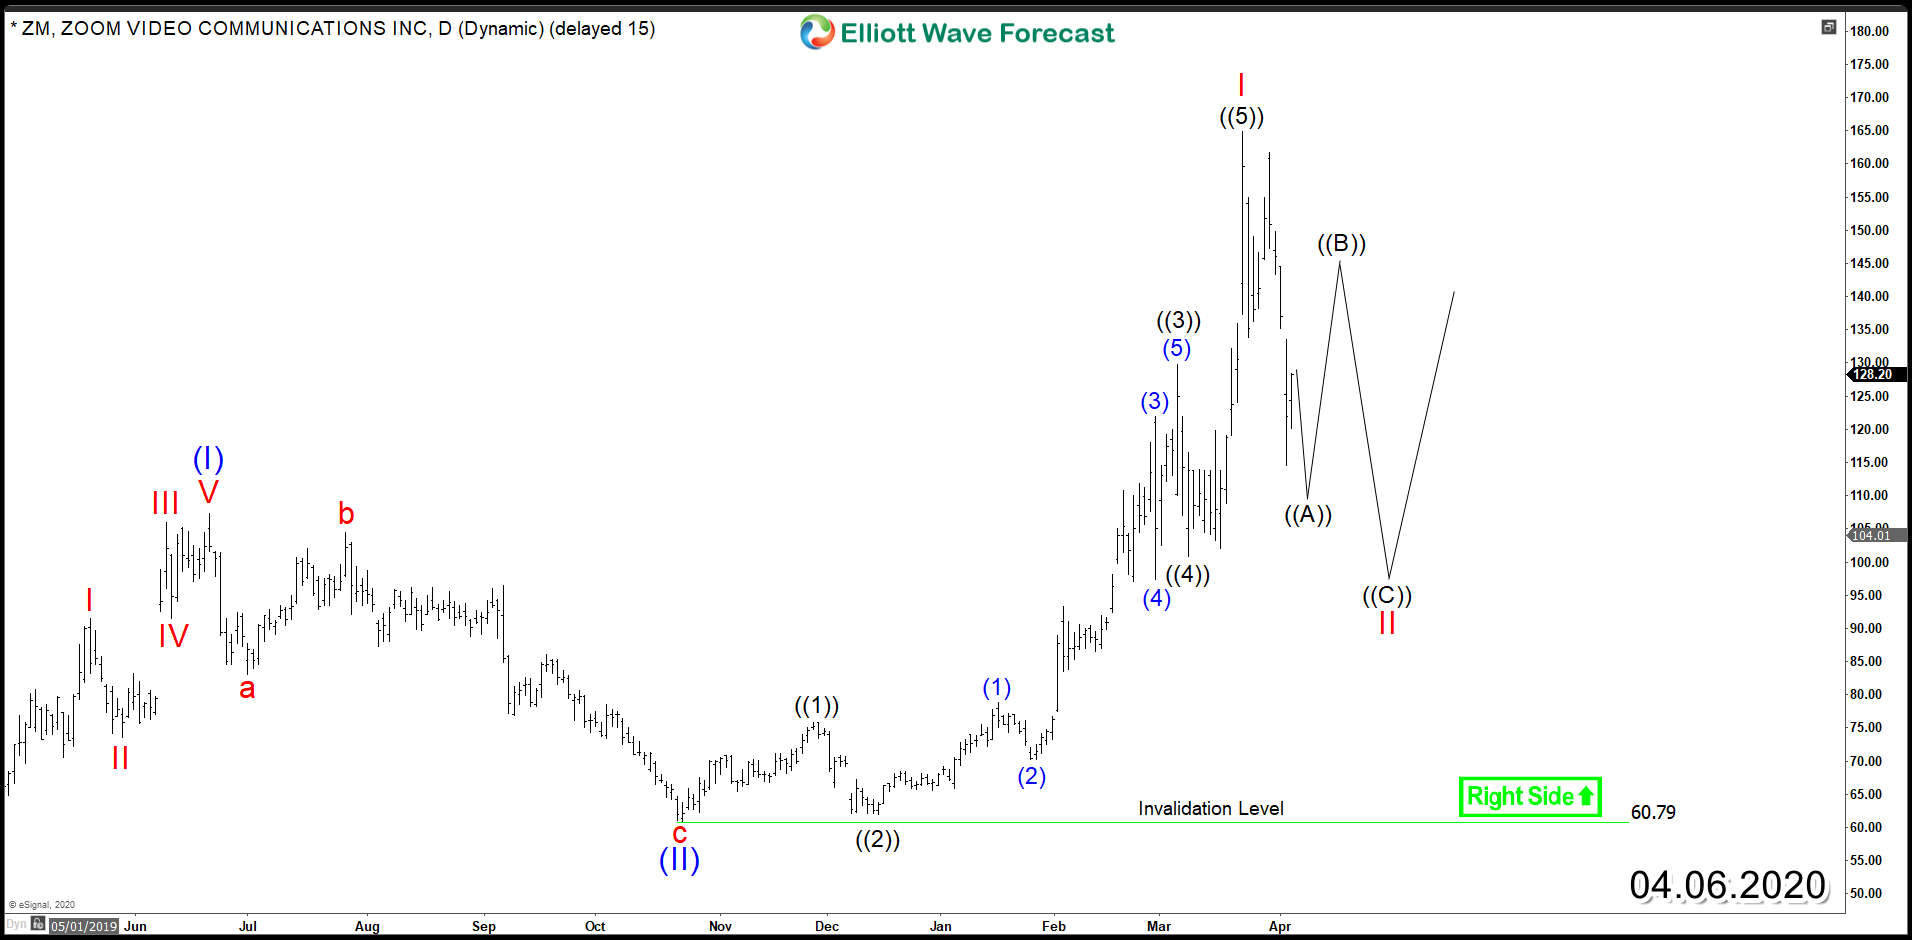
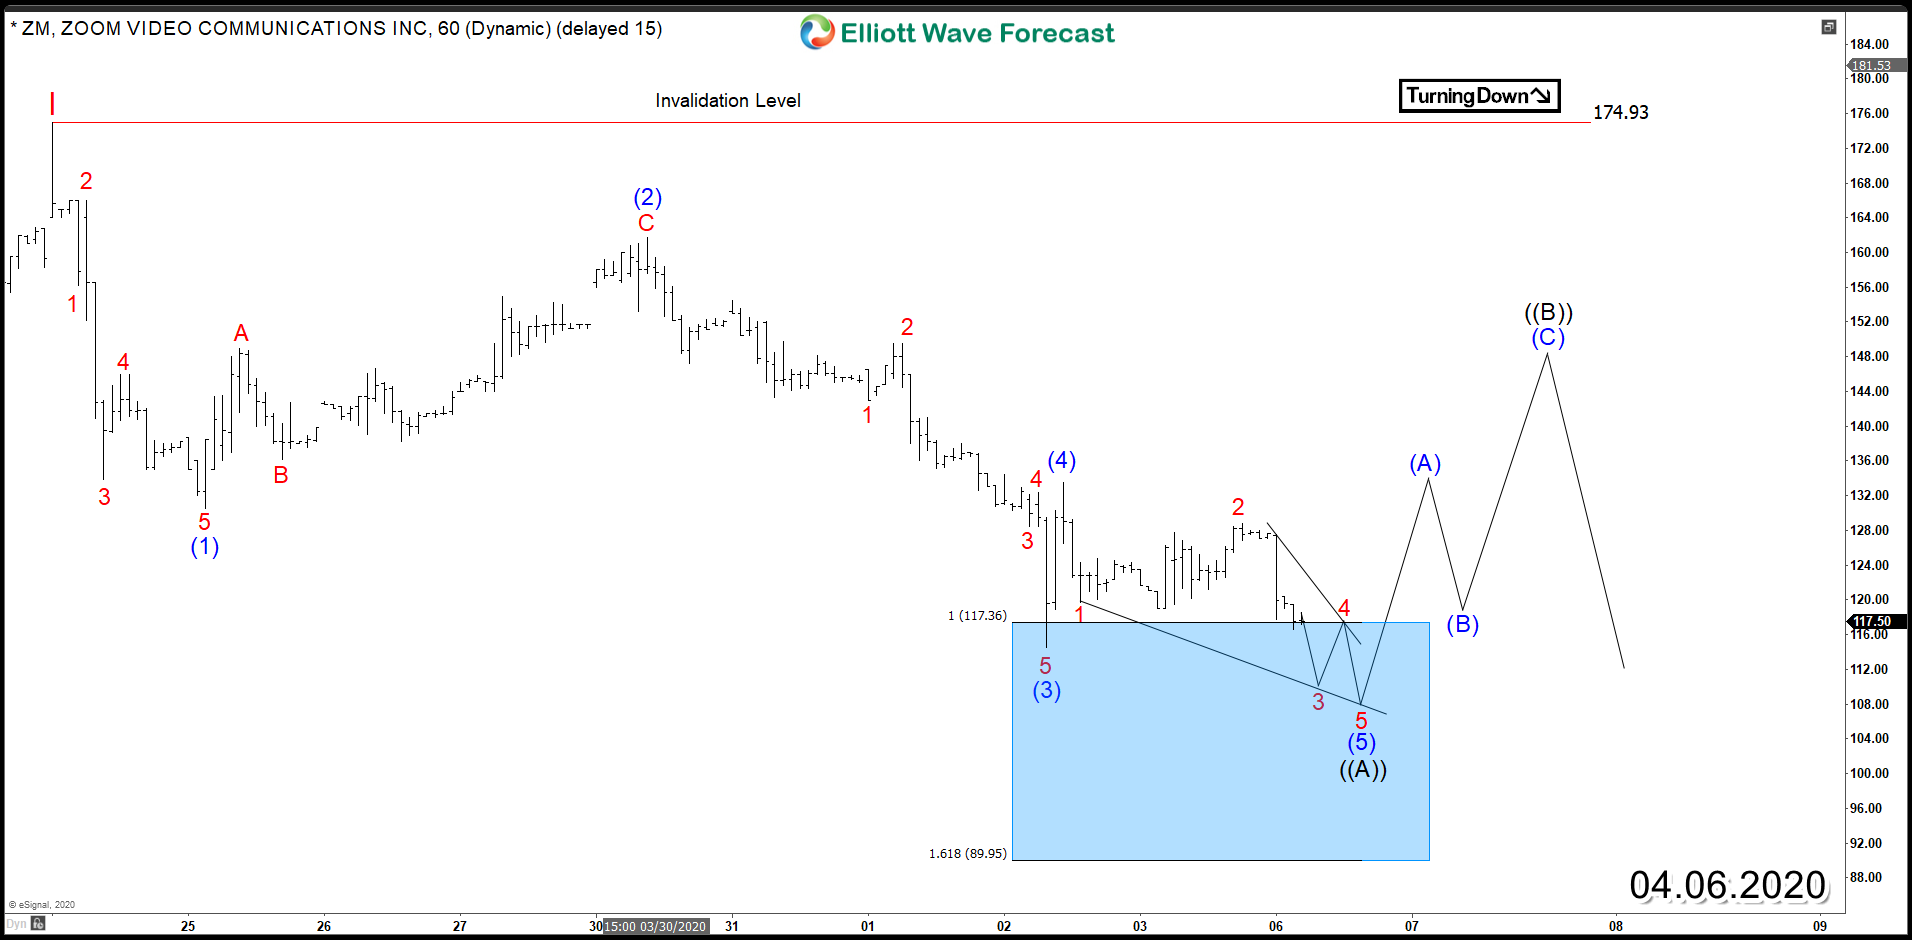
1- ZM is only ending the first leg ((A)) of a 3 waves zigzag structure to correct the cycle from October 2019 low and short term bounce ((B)) will be expected to fail below $174.9 peak before another leg lower ((C)) takes place to finish wave II which would represent a buying opportunity later on then the stock will turn higher again.
ZM Daily Chart
ZM 1 Hour Chart
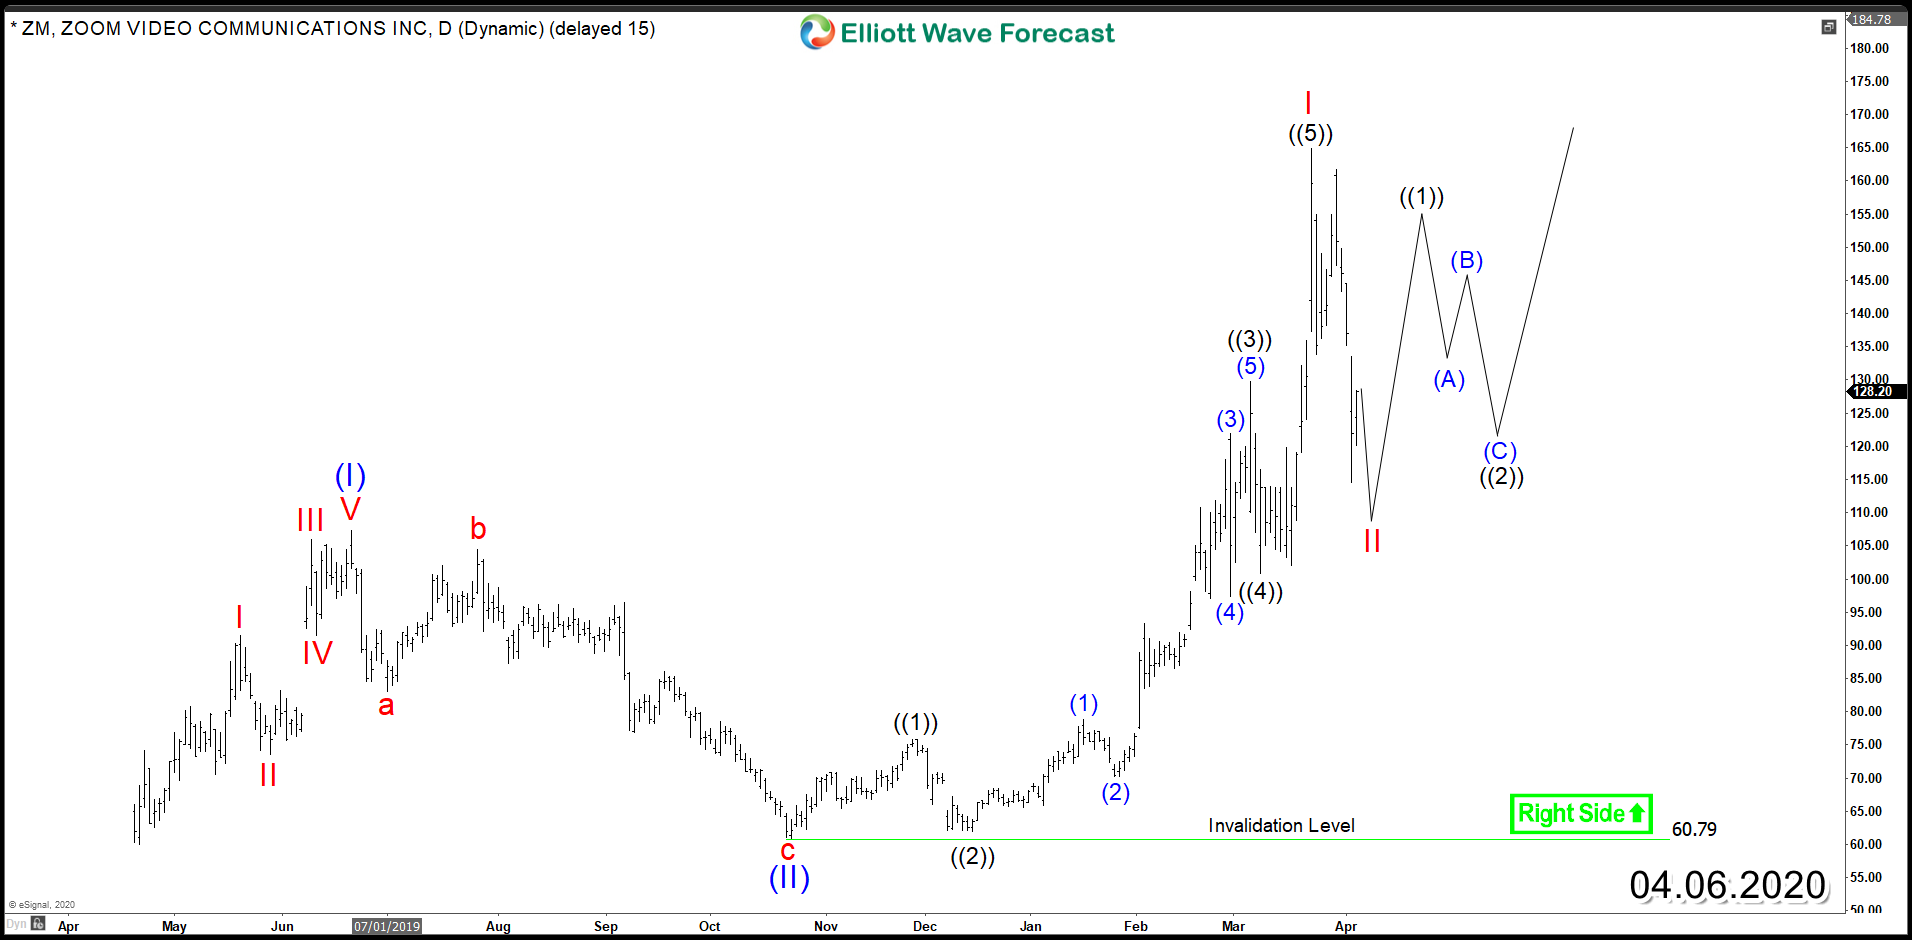
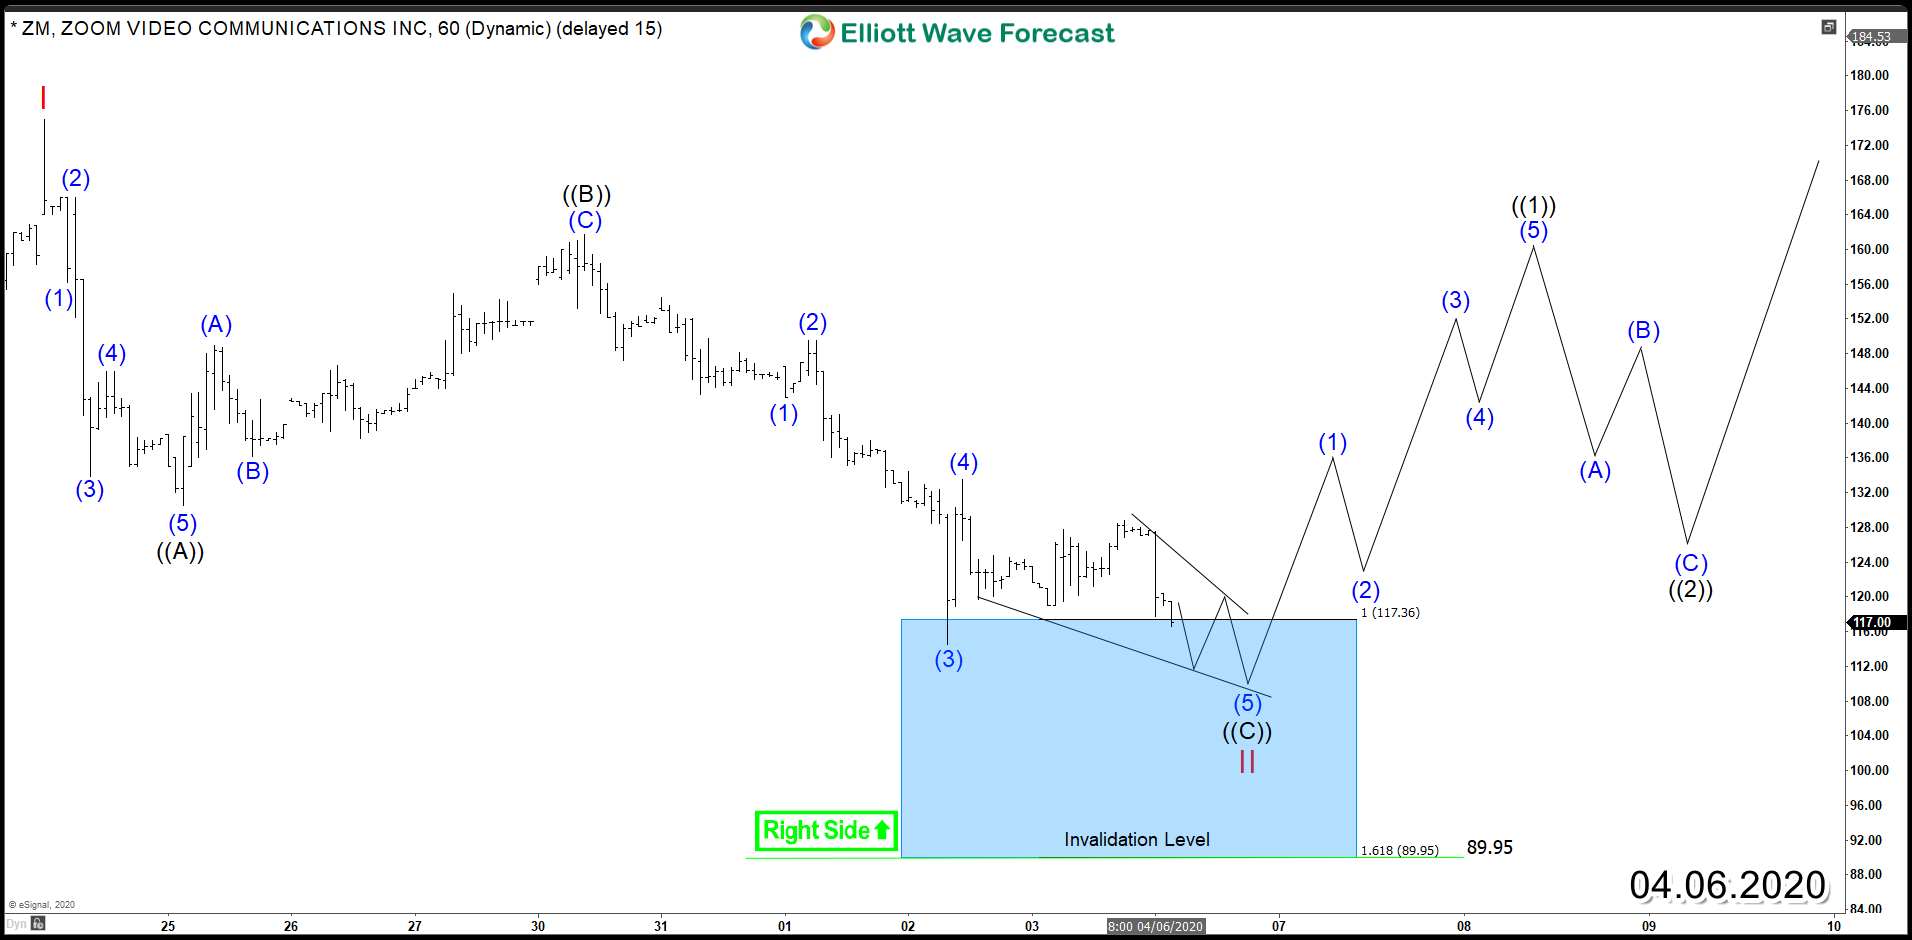
2- ZM is already ending the corrective 3 waves Zigzag structure around equal legs area $117- $89 where buyers are expected to show up looking for the stock to resume the rally within the main trend which in this case would represent a trading opportunity even for the short term. However, the stock would need a break above 3/24 peak to confirm the continuation higher within a new bullish cycle.
ZM Alternative Daily Chart
ZM Alternative 1 Hour Chart
Consequently, Zoom current structure is supporting the stock into the future even if it ends up finishing a 5 waves advance just after making new all time highs it would still find buyers during the next correction in 3, 7 or 11 swings based on the initial impulsive rally which the stock established since IPO.