Bullish Continuation Expected as IDEX Sets Up for the Next Impulsive Rally in Wave (3)
IDEX Corporation (NYSE: IEX) is showing signs of completing its wave (2) correction within a broader bullish Elliott Wave cycle. The long-term chart highlights a strong impulsive trend that began in the early 1990s. Since then, the stock has advanced through multiple Elliott Wave degrees, forming a sustained upward structure.
After peaking around late 2021, IEX entered a corrective phase. This move is labeled as wave (2) and is forming a classic A-B-C zigzag correction. Wave A and B are already complete, while wave C is likely in its final stages. This suggests the pullback could soon end, setting the stage for a bullish reversal.
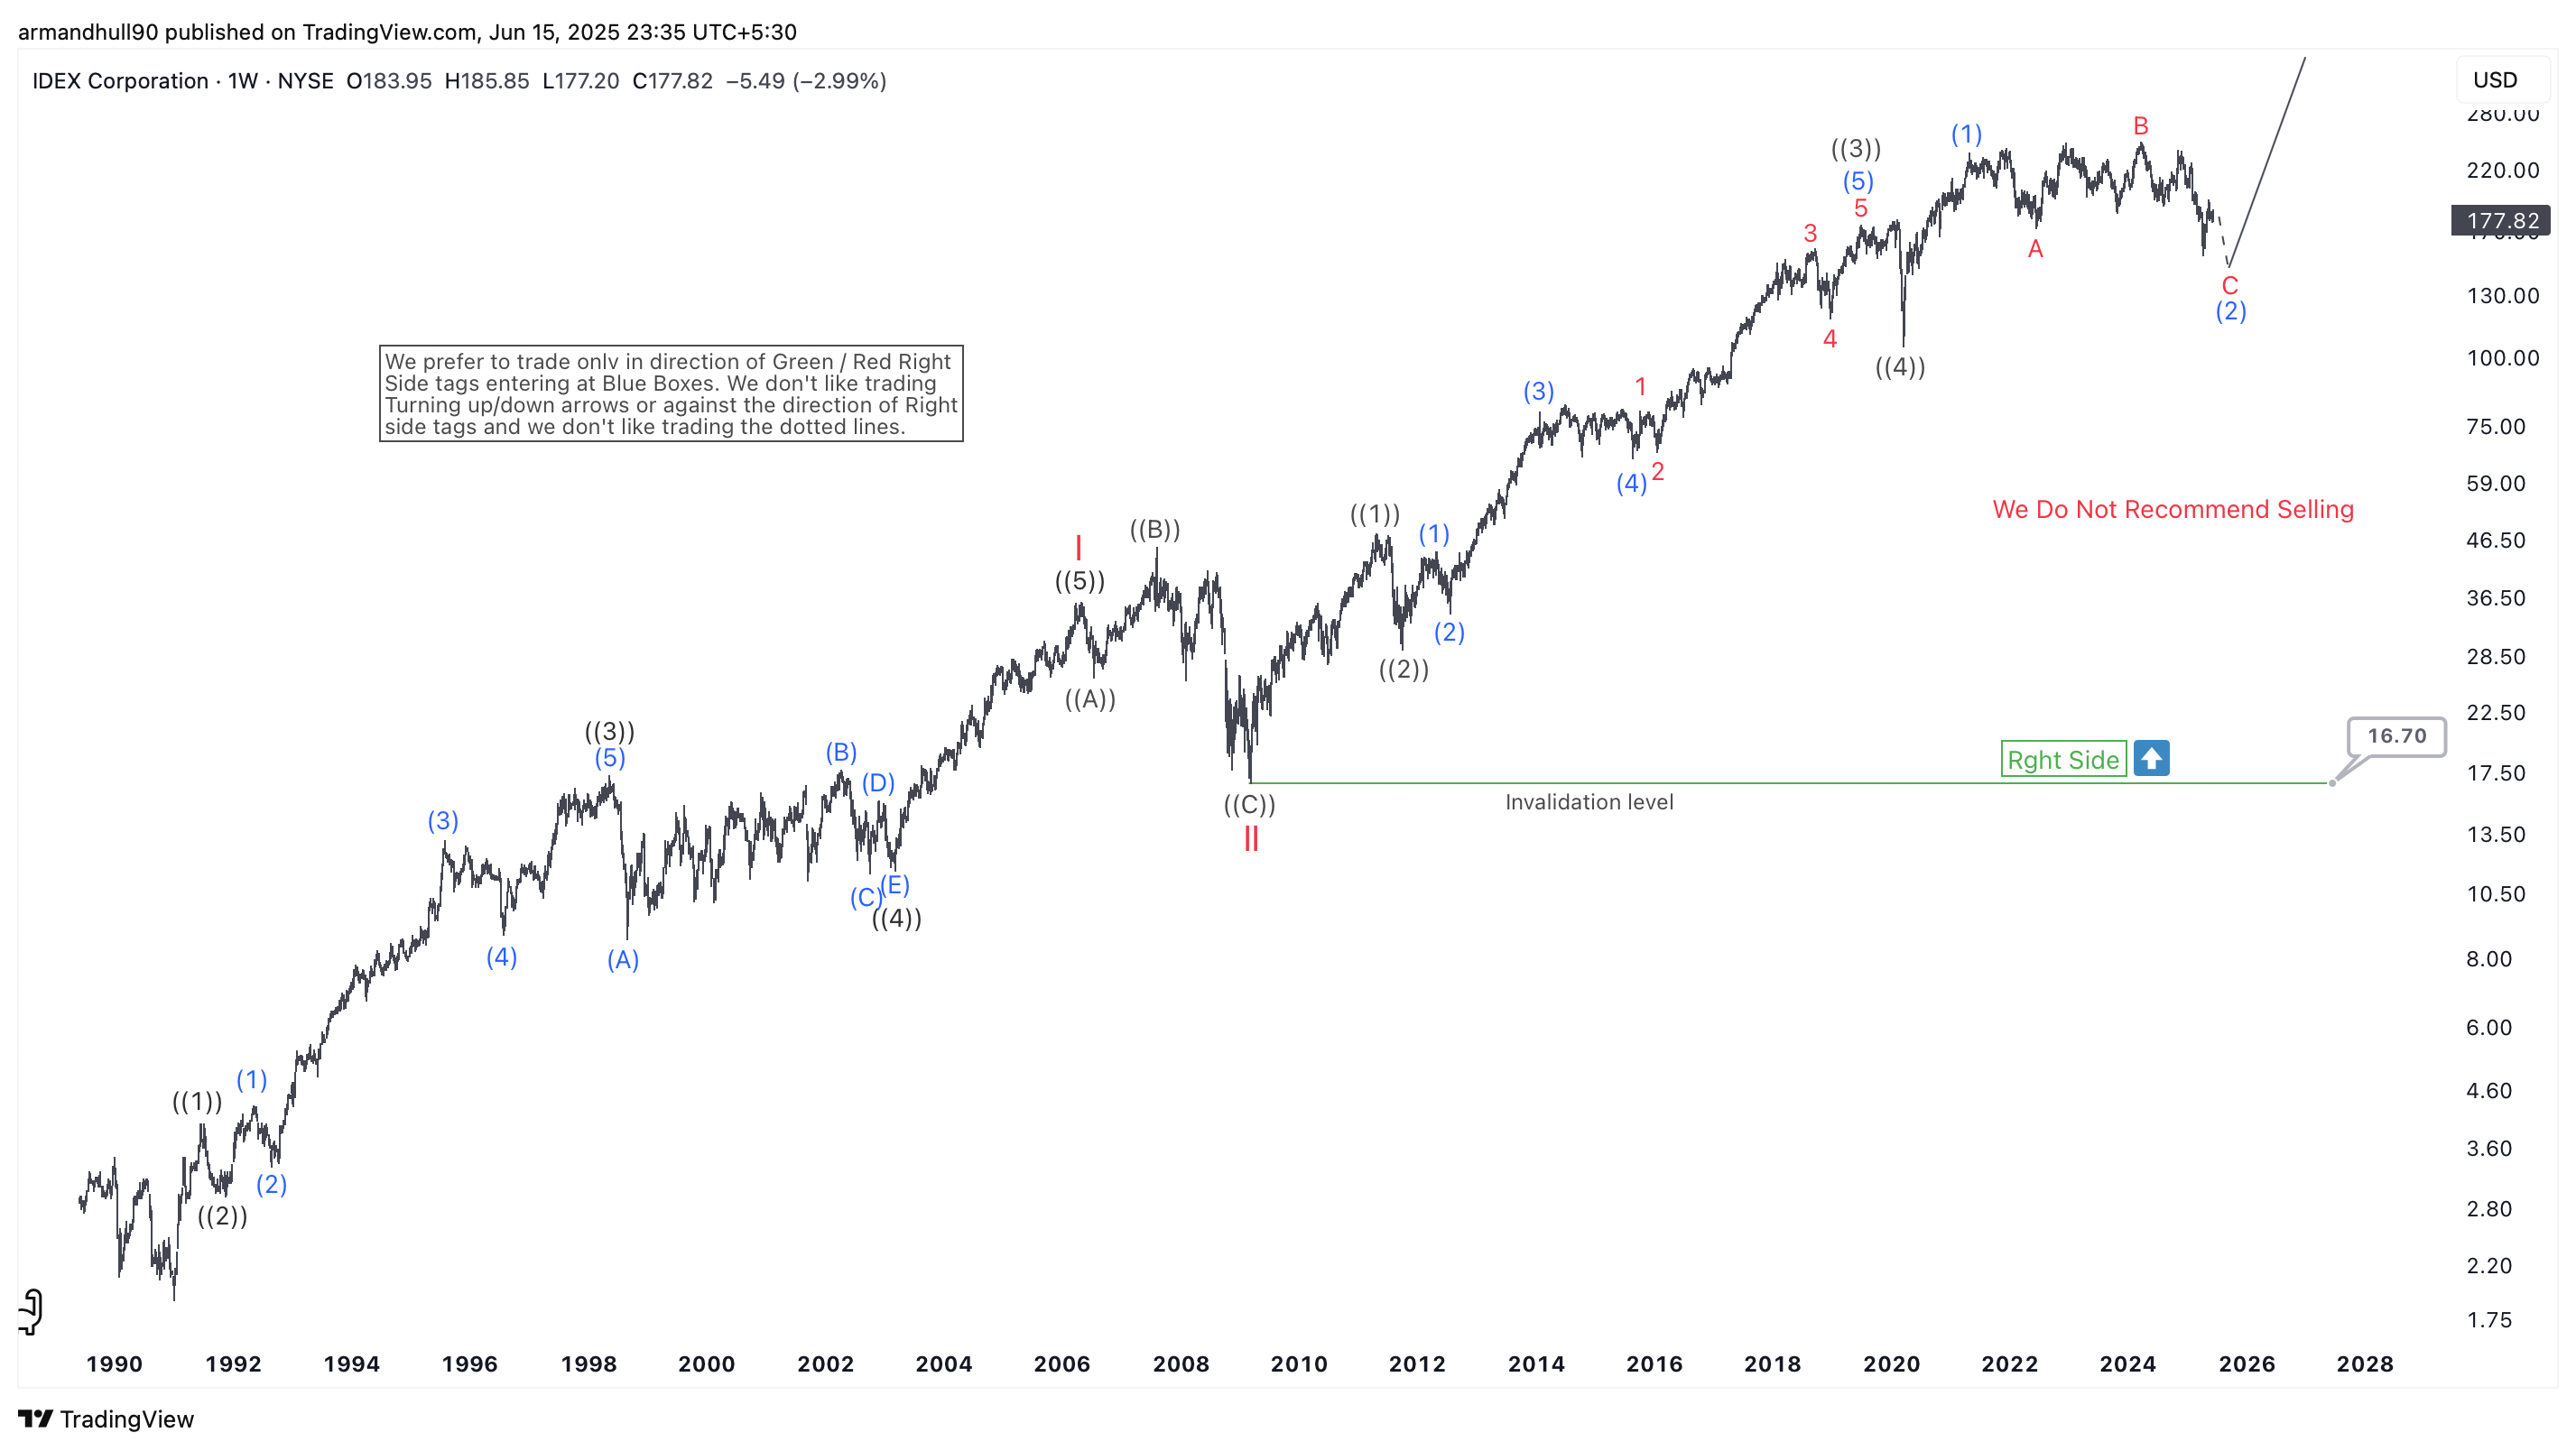
A clear “Right Side” tag on the chart indicates that the preferred trading direction is higher. This aligns with the larger trend and long-term bullish bias. Additionally, the chart carries a warning — “We Do Not Recommend Selling” — which reinforces the view that the current weakness should be treated as an opportunity rather than a trend reversal.
The invalidation level stands far below at $16.70, offering a solid technical floor. As long as the price remains well above this level, the long-term bullish count remains intact. Once wave (2) completes, IEX is expected to resume its uptrend in wave (3), which typically shows strong acceleration and momentum.
Conclusion:
In conclusion, IDEX Corporation is likely nearing the end of its wave (2) correction. Long-term investors and trend-followers should watch closely for bullish confirmation and be prepared for the next impulsive rally that could unfold in the coming months. The current pullback may offer a favorable risk-reward setup for positioning into wave (3).
Source: https://elliottwave-forecast.com/stock-market/idex-corporation-iex-elliott-wave-weekly-analysis/