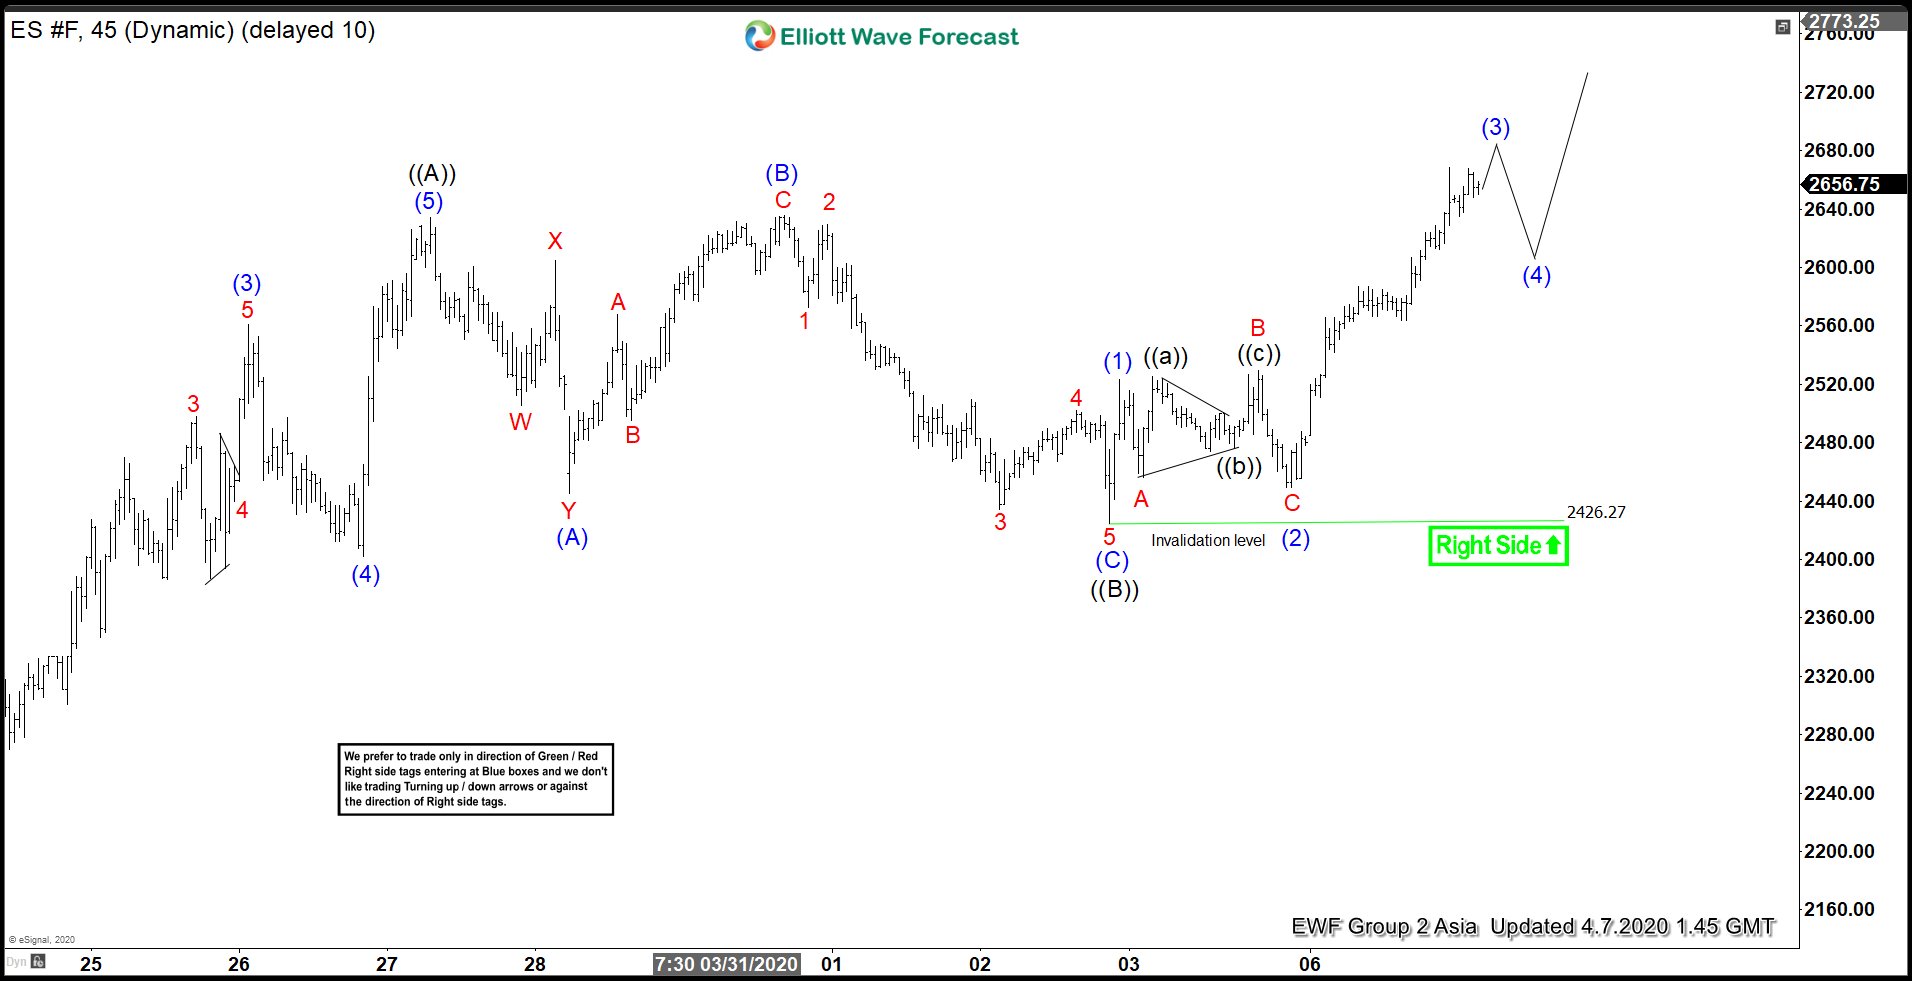
S&P 500 E-Mini Futures (ES_F) broke above last week’s high at 2635.75 and shows incomplete sequence from 3.23 low, favoring further upside in near term. Short Term Elliott Wave suggests the rally from 3.23 low (2174) is unfolding as Elliott Wave zigzag structure. Up from 3.23 low, wave ((A)) ended at 2634.5.
Internal of wave ((A)) unfolded as 5 waves impulse where wave (1) ended at 2386 and wave (2) ended at 2179.5. Index resumed higher again in wave (3) towards 2560.75, and wave (4) ended at 2402.25. The last leg wave (5) ended at 2634.5 which also completed wave ((A)). Pullback in wave ((B)) unfolded as an Expanded Flat structure. Wave (A) ended at 2445, wave (B) ended at 2635.75, and wave (C) of ((B)) ended at 2426.27.
Wave ((C)) remains in progress as 5 waves impulse where wave (1) ended at 2523, and wave (2) ended at 2449. Near term, while dips stay above 2426.27, expect Index to extend higher within wave (3). It should then pullback in wave (4) then extend higher again in wave (5) of ((C)). Potential target for wave ((C)) is 100% – 123.5% Fibonacci extension from 3.23 low which comes at 2888 – 2997.
S&P 500 Futures (ES_F) 1 Hour Elliott Wave Chart