
It is very well-known around the trading community that we at EWF has always been very bullish on the World Indices. With every dip over the years, we have been telling members to buy. However, we run a system that provides a warning this time. The Elliott Wave Theory is known for providing alternate views. This is the reason why we have added more rules and tools to filter the views.
Please watch this video to see how we were able to buy the dips in 2020 even when the Theory might have been calling for another leg lower. It was evident at that moment and the whole market was in complete agreement. At that moment, the $USDX was ready to sell, and the YEN pairs were ready to buy. In other words, it was the perfect time across the Marketplace. Here is the chart of the $USDSGD and GOLD to Silver Ratio.
$USDSGD Weekly Elliott Wave Chart Sends Warning to World Indices

Back in 2020, the market suggested $USDX weakness because the $USDSGD was within the 100% area off the lows at 01.22.2018. As expected, the pair sold off, keeping $USDX weakness and therefore Indices higher. The AUG (Gold-Silver ratio) was also trading within the Blue Box area and expected to drop, supporting yet another $USDX weakness.
Gold-to-Silver Ratio Quarterly Elliott Wave Chart
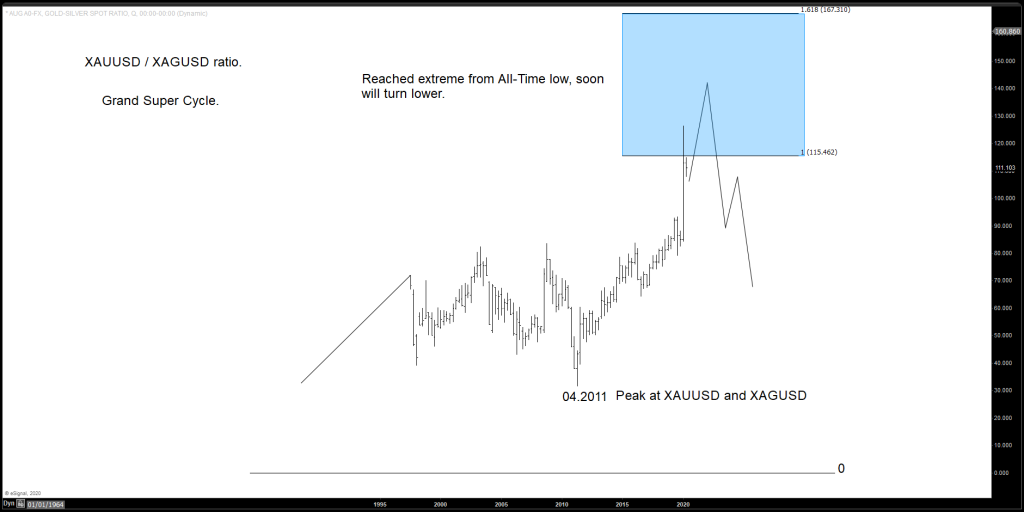
Quarterly chart above shows the ratio is trading within the Blue Box area and expected to drop. This also supports the idea of USD weakness and therefore higher Indices.
Most of the World Indices dropped in three waves from the all-time high. However, the alignment is not there at this time for Indices to extend higher. The Elliott Wave Theory corrective sequence runs in 3-7-11-15-19 swings. The idea that three waves ended off the peak at 2021 or 2022 does not mean the Indices can not extend lower in 7 swing.
We will use the same instruments explained above and show where they stand now. We will find out why we need to be very smart this time around. As the weekly chart below shows, the $USDSGD is trading within the 100% extension since the peak at 03.2020.
$USDSGD Weekly Elliott Wave Chart
The chart above sends a warning for the $USDX shorts. $USDSGD chart says it is at a risk of a bounce minimum to correct cycle from 09.2022. If it extends the rally higher further to correct larger degree, Indices can be under pressure. That’s why we need to be smart with the Indices, We don’t question that the trend in World Indices is bullish. Sooner or later, they will trade to new highs. But there’s yet not 100% alignment with the other asset group, thus why we need to be careful.
Gold-to-Silver Ratio Daily Elliott Wave Chart
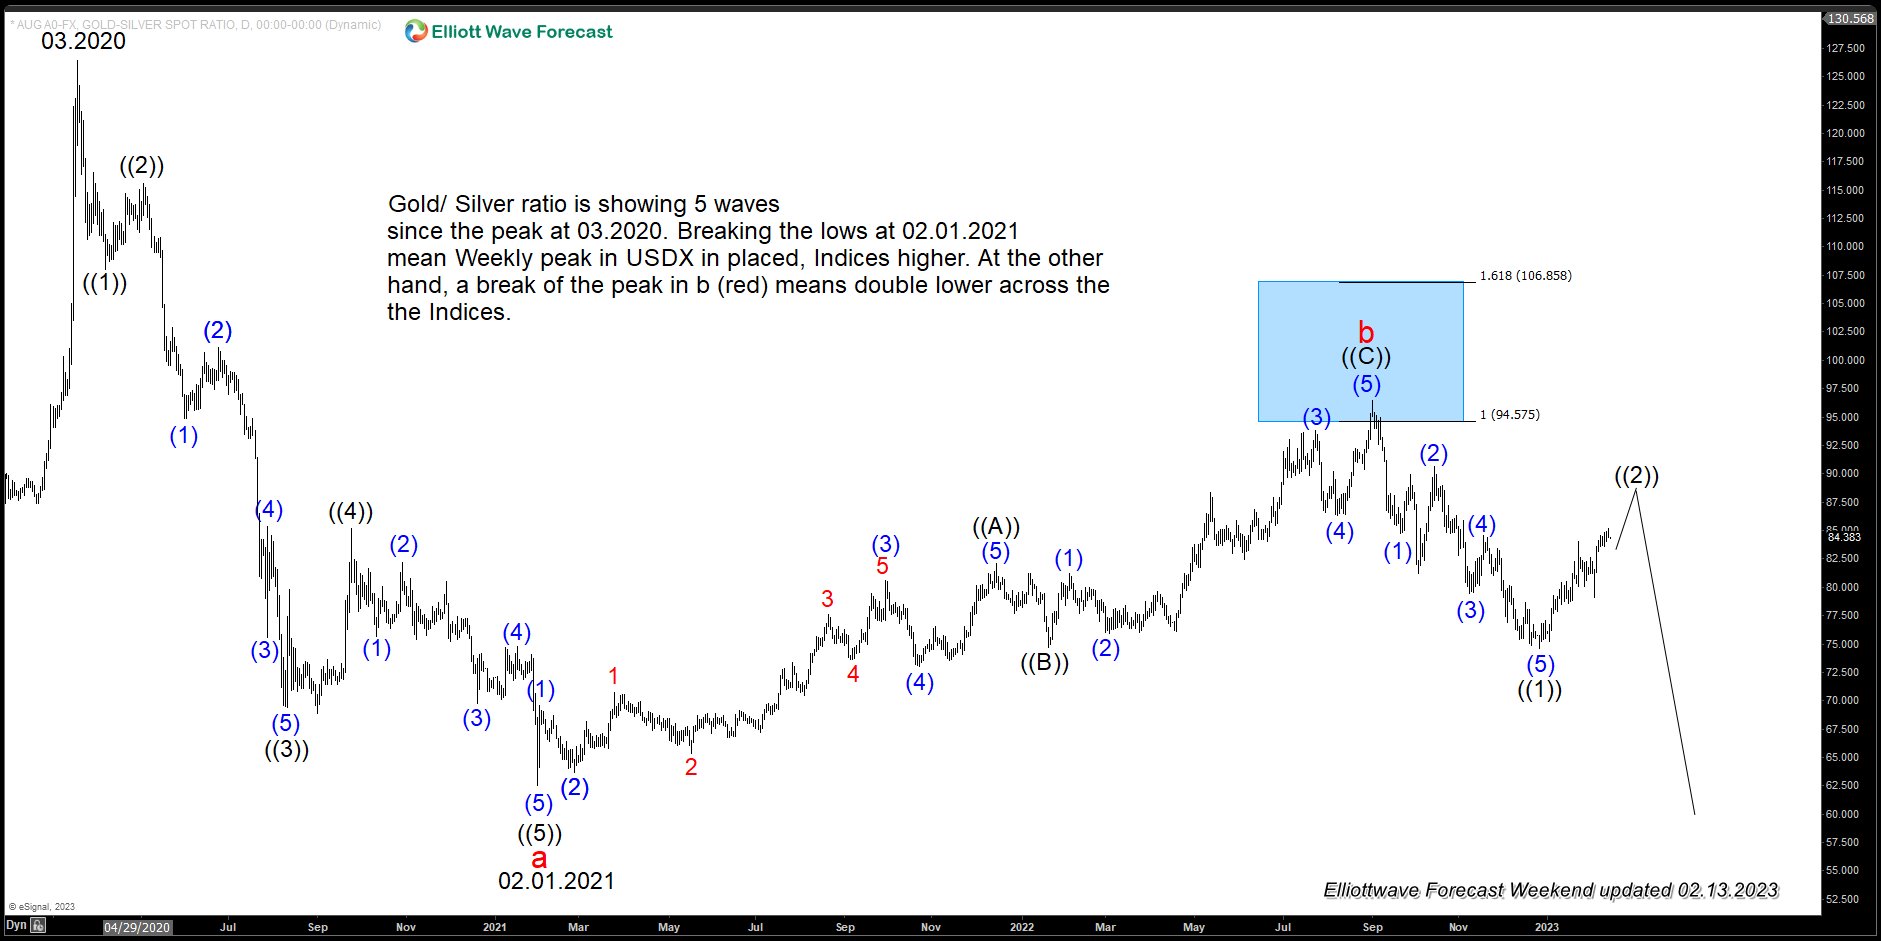
The daily cart above shows the current stage of the Gold/Silver ratio. At this moment, it is not saying much. The ratio can either do a double higher off the 01.2021 lows or extend lower from 03.2020 high. If it extends lower from 3.2020 high, the Indices might have a low in place and ready to resume higher. But if the ratio does a double higher, then Indices can extend lower again and $USDSGD extends higher.
The Elliott Wave Theory provides many structures, and the FLAT is the tricky one to spot. Due to the nature of the five waves off the lows, many wavers will run and overreact to the five waves’ advance.

The graphic above shows what a Flat structure looks like in the Elliott Wave Theory. Typically it happens that when the last low (wave B in the graphic above) is only marginal and does not reach the 100% extension from the peak. The last low also comes with divergence. When this conditions presents, there is always a chance for the Flat structure. Despite what looks to be an impulsive move higher off the low in World Indices, if USDSGD extends higher and Gold-to-Silver ratio does a double higher, then World Indices can do a flat and then extends lower in a double correction from 2021 / 2022 peak.
In conclusion, World Indices are reacting higher in an impulse way. This should be taken into consideration for the next few weeks and months. Still, at the same time, the perfect timing is not there as USDSGD reaches 100% from 3.2020 high. Unlike in 2020, we cannot deny the possibility of the Flat or seven swings lower in Indices. The Elliott Wave Theory is subjective and our system is better. Right now, we need to be smart and let the market makers decide until more data. Being smart means trading the impulse off the lows at either September/ October 2022. But understand Indices are part of the Market, and the $USDSGD timing sends a warning.
Source: https://elliottwave-forecast.com/stock-market/world-indices-time-to-be-aggressive-or-smart/