Hello fellow traders. In this technical blog we’re going to take a quick look at the Elliott Wave charts of AMD stock published in members area of the website. As our members know, AMD is showing an impulsive bullish sequence in the cycle from the 75.22 low. Recently, the stock has completed a 3-wave pullback against the 107.08 low. The pullback formed an Elliott Wave Zigzag pattern, after which we saw a further rally toward new highs. In the following text, we will explain the Elliott Wave pattern and present the target areas.
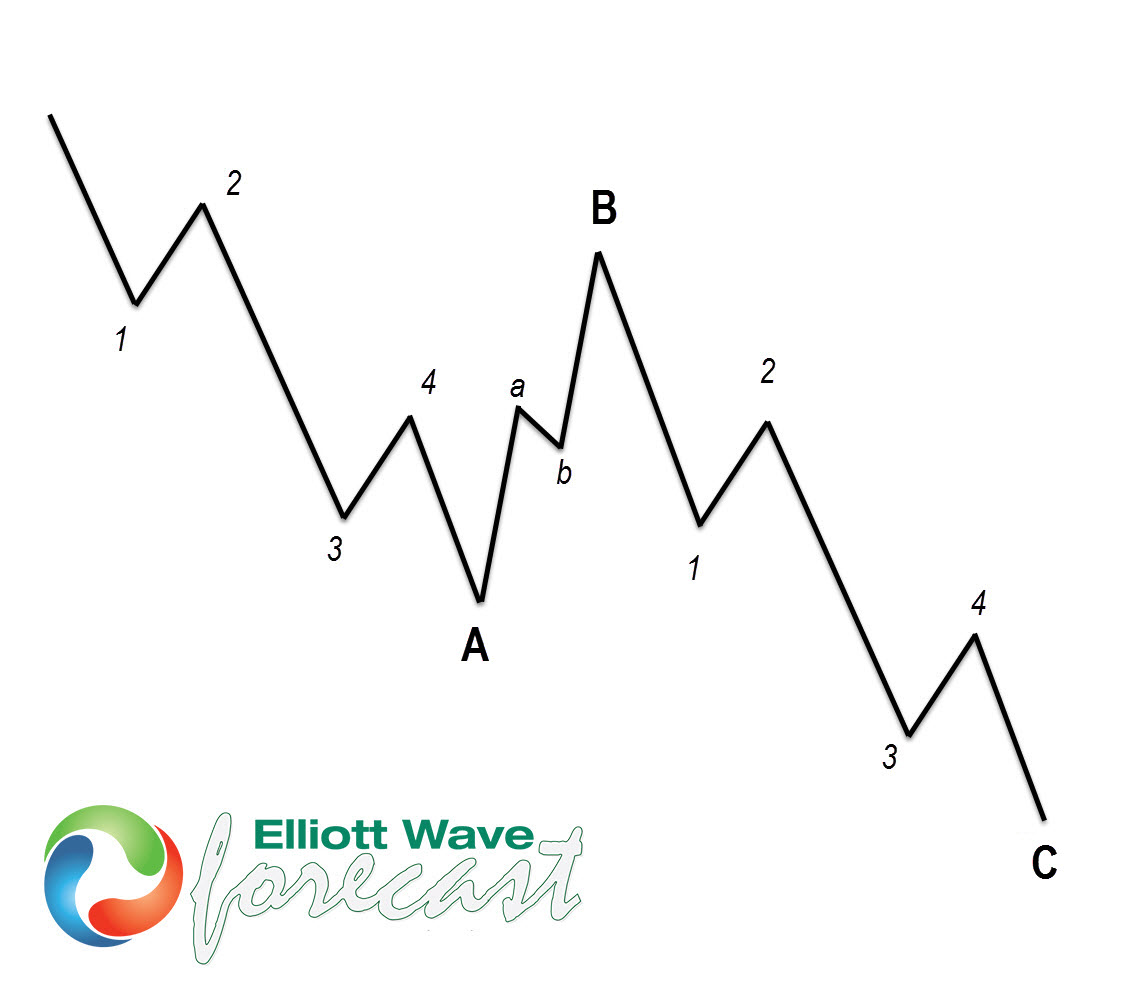
Before we take a look at the real market example, let’s explain Elliott Wave Zigzag pattern.
Elliott Wave Zigzag is the most popular corrective pattern in Elliott Wave theory . It’s made of 3 swings which have 5-3-5 inner structure. Inner swings are labeled as A,B,C where A =5 waves, B=3 waves and C=5 waves. That means A and C can be either impulsive waves or diagonals. (Leading Diagonal in case of wave A or Ending in case of wave C) . Waves A and C must meet all conditions of being 5 wave structure, such as: having RSI divergency between wave subdivisions, ideal Fibonacci extensions and ideal retracements.
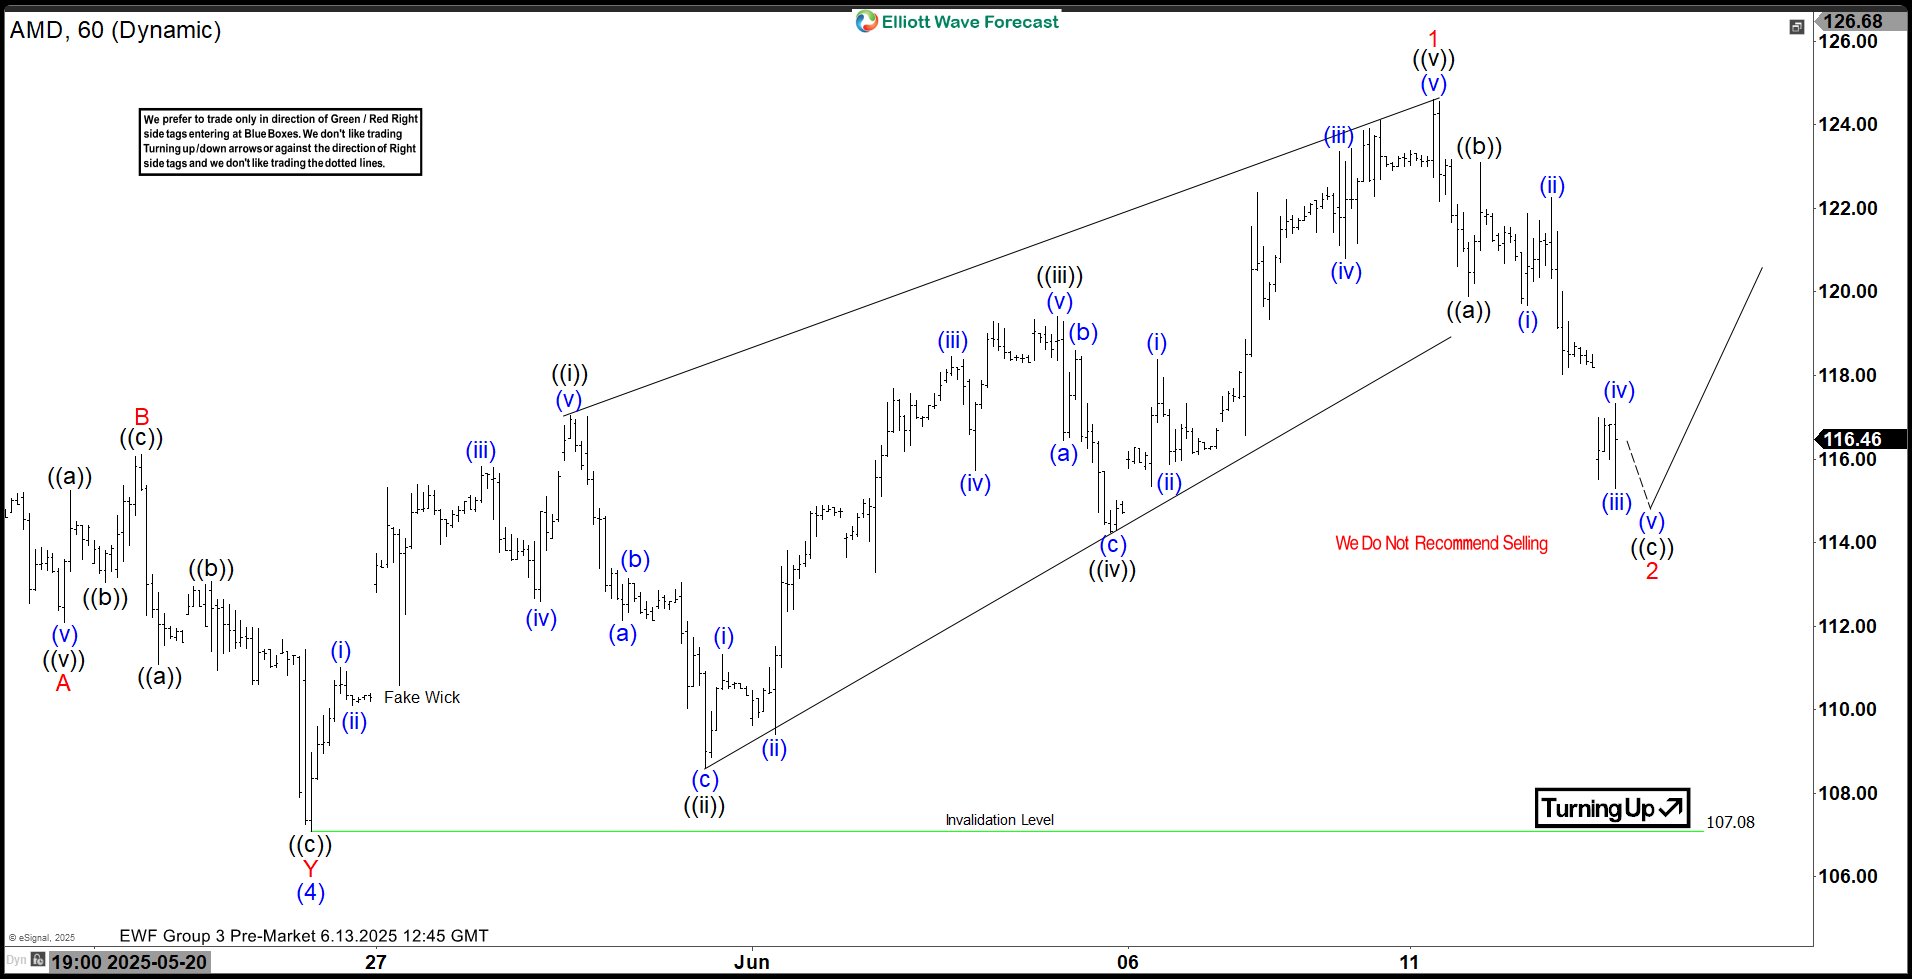
AMD H1 Elliott Wave Pre-Market Analysis 06.13.2025
AMD ended the cycle from the 107.08 low as a 5-wave pattern labeled as wave 1 in red. Currently, it is undergoing a 3-wave pullback labeled as wave 2 in red, unfolding as an Elliott Wave Zigzag pattern. When we break down the structure, we can clearly count 5 waves in the first leg ((a)), followed by a 3-wave bounce in ((b)), and the stock is now trading within the ((c)) leg, which could still see a marginal new low to complete its own 5-wave structure. We do not recommend trading at this stage and continue to favor the long side in the stock.
📈 How well do you really know the stock market?
Take our Stock Market Quiz and put your knowledge to the test!
Note: Keep in mind not every chart is trading recommendation. Official trading strategy on How to trade 3, 7, or 11 swing and equal leg is explained in details in Educational Video, available for members viewing inside the membership area.
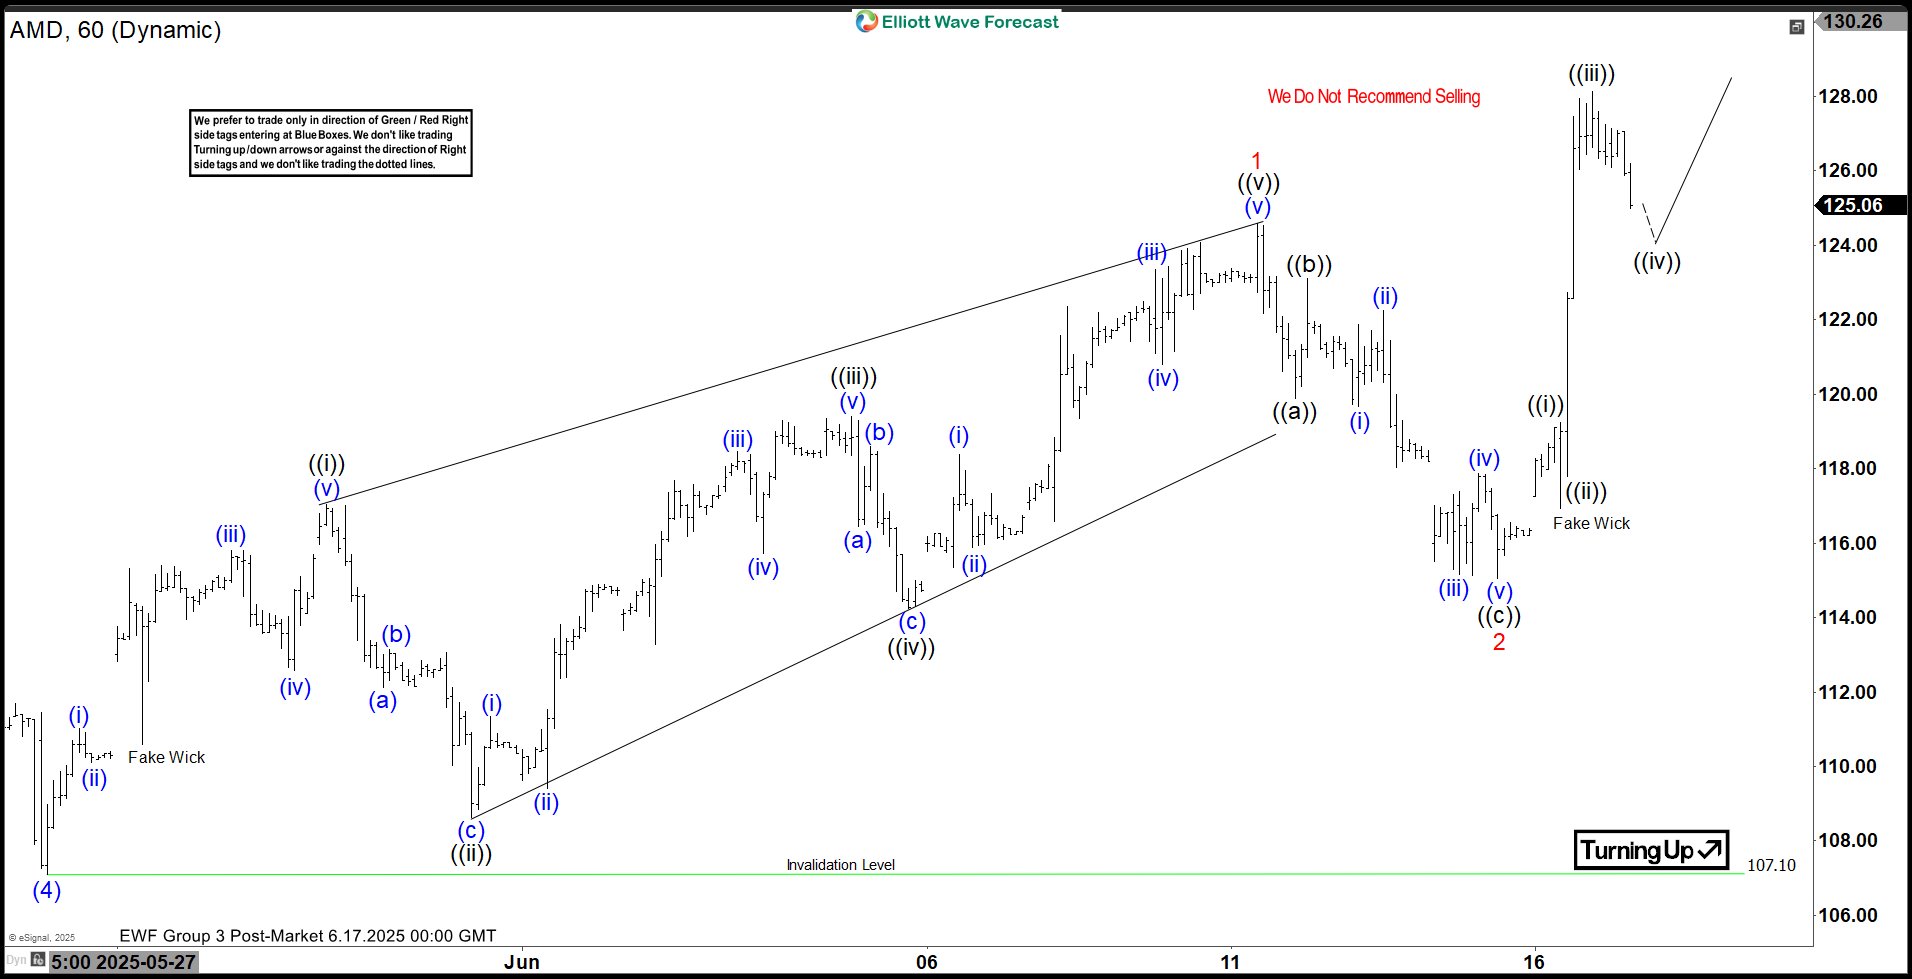
AMD H1 Elliott Wave Pre-Market Analysis 06.13.2025
The stock has completed the red wave 2 correction as an Elliott Wave Zigzag pattern, followed by a rally to new highs. It is now displaying a higher high sequence in the cycle from the 107.1 low, suggesting a potential for further upside. The next target area stands at 132.23–136.27.
Keep in mind that market is dynamic and presented view could have changed in the mean time. You can check most recent charts with target levels in the membership area of the site. Best instruments to trade are those having incomplete bullish or bearish swings sequences. We put them in Sequence Report and best among them are shown in the Live Trading Room.
New to Elliott Wave ? Check out our Free Elliott Wave Educational Web Page and download our Free Elliott Wave Book.
Source: https://elliottwave-forecast.com/stock-market/amd-elliott-wave-bullish-sequences/


