
Hello everyone! In today’s article, we’ll examine the recent performance of American Airlines Group Inc. ($AAL) through the lens of Elliott Wave Theory. We’ll review how the decline from the May 14, 2025 high unfolded as a 3-swing correction (ABC)and discuss our forecast for the next move. Let’s dive into the structure and expectations for this stock.
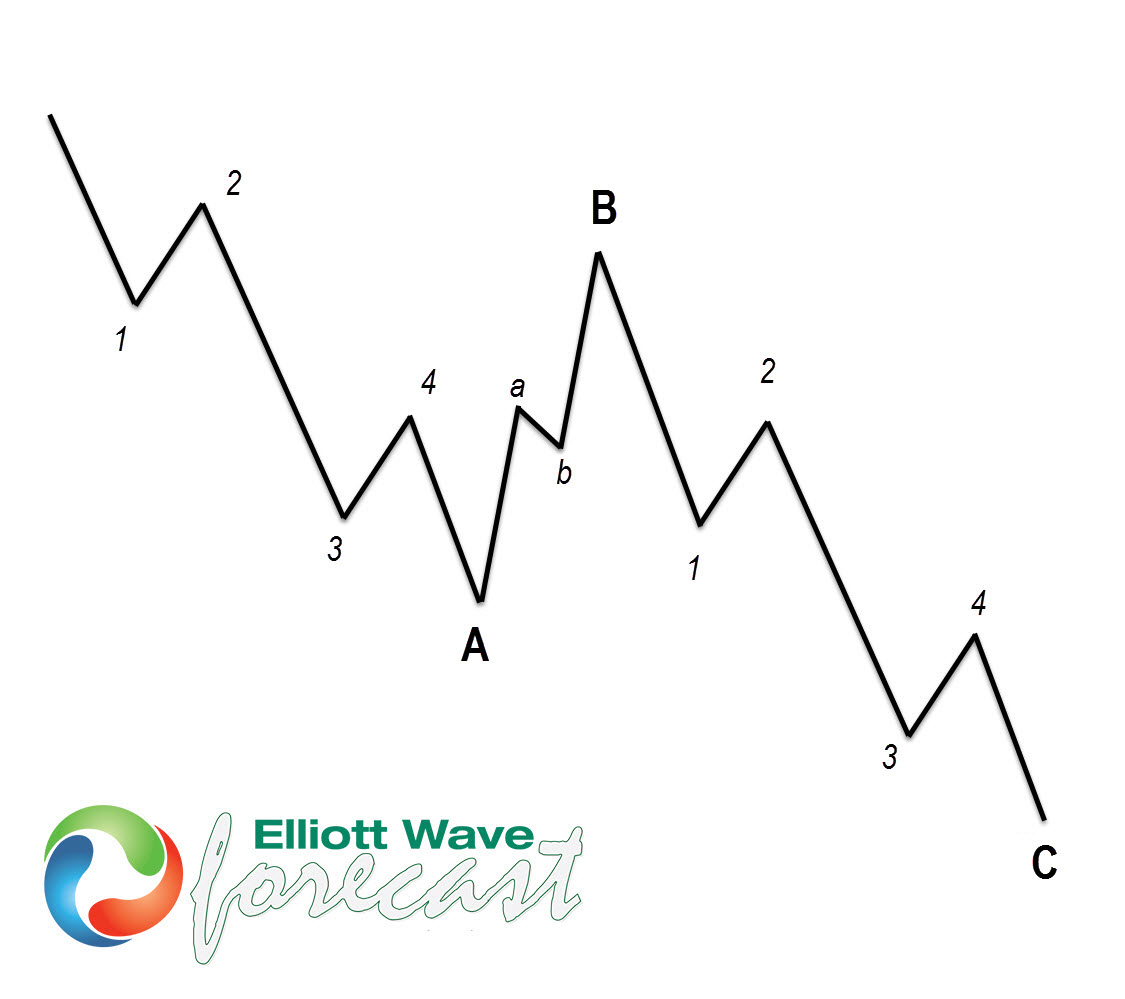
ABC correction (Zig-Zag)
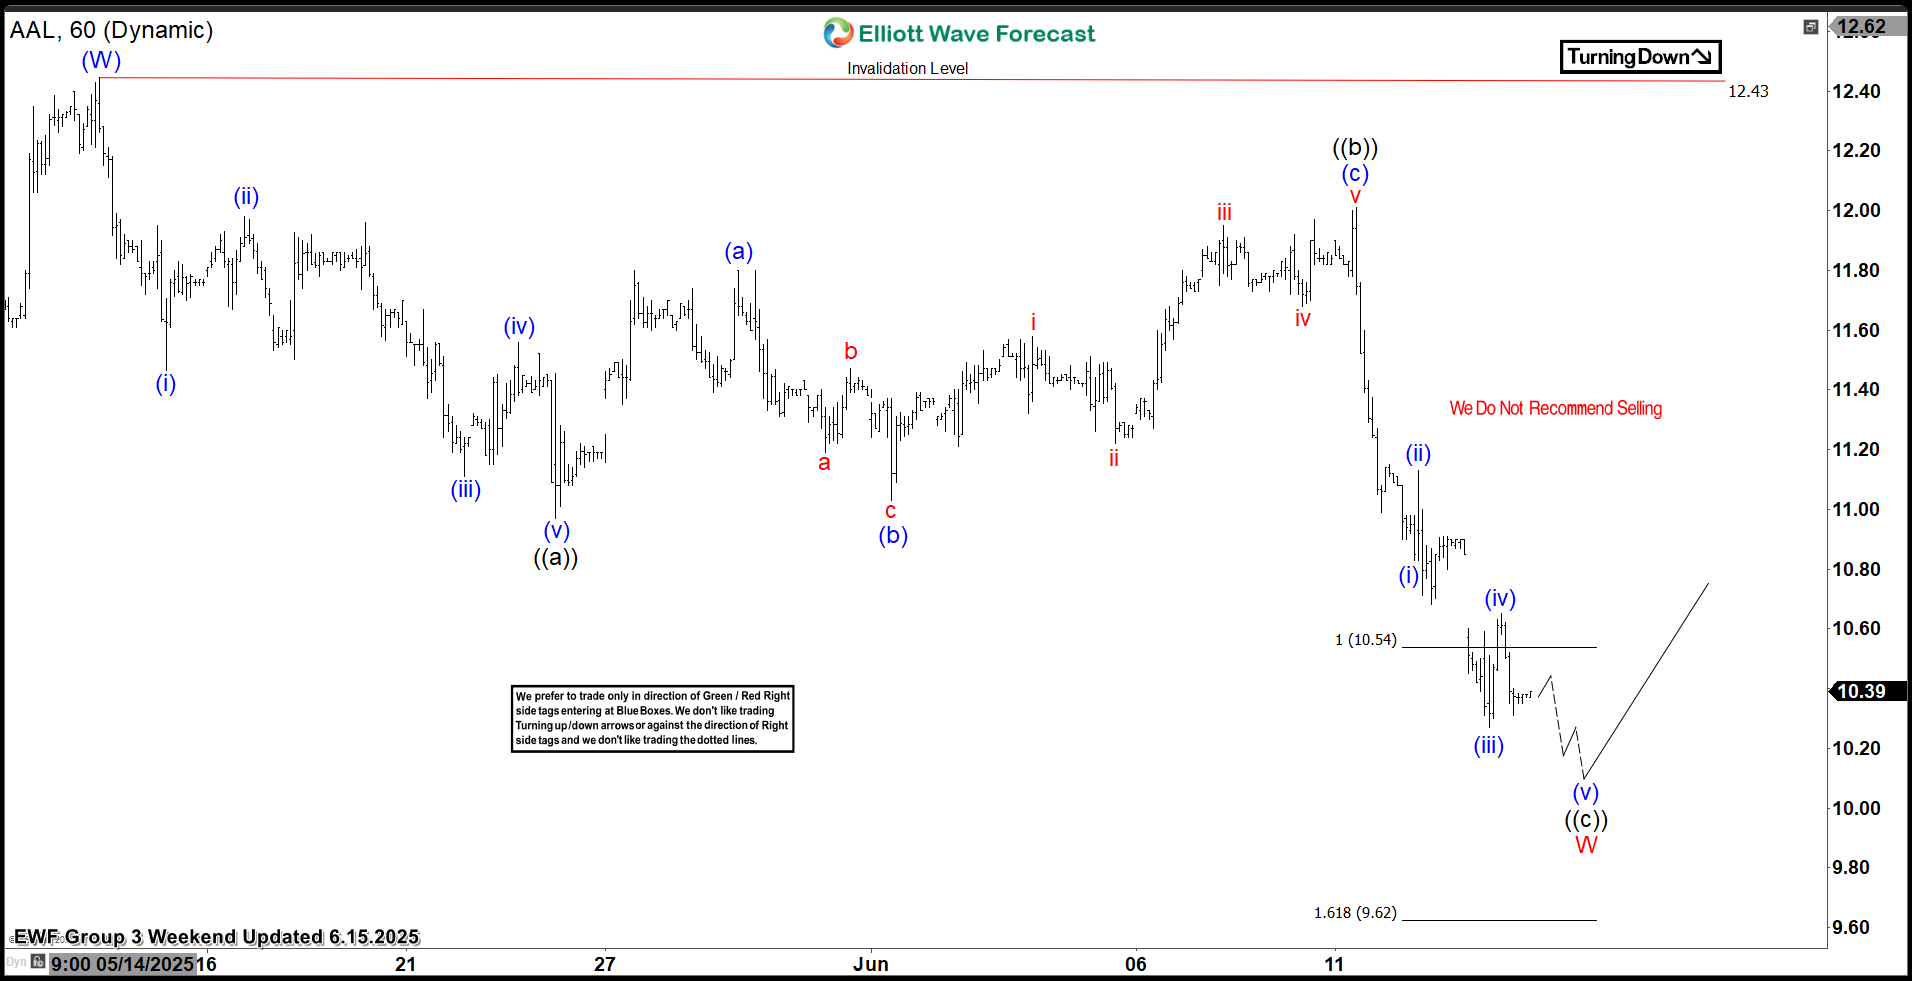
$AAL 1H Elliott Wave Chart 6.15.2025:
In the 1-hour Elliott Wave count from June 15, 2025, we saw that $AAL pullback has unfolded in 3 swings, reaching equal legs area between $10.54 and $9.62. where buyers are expected to enter.
This setup aligns with a typical Elliott Wave correction pattern (ABC), in which the market pauses briefly before resuming its primary trend.
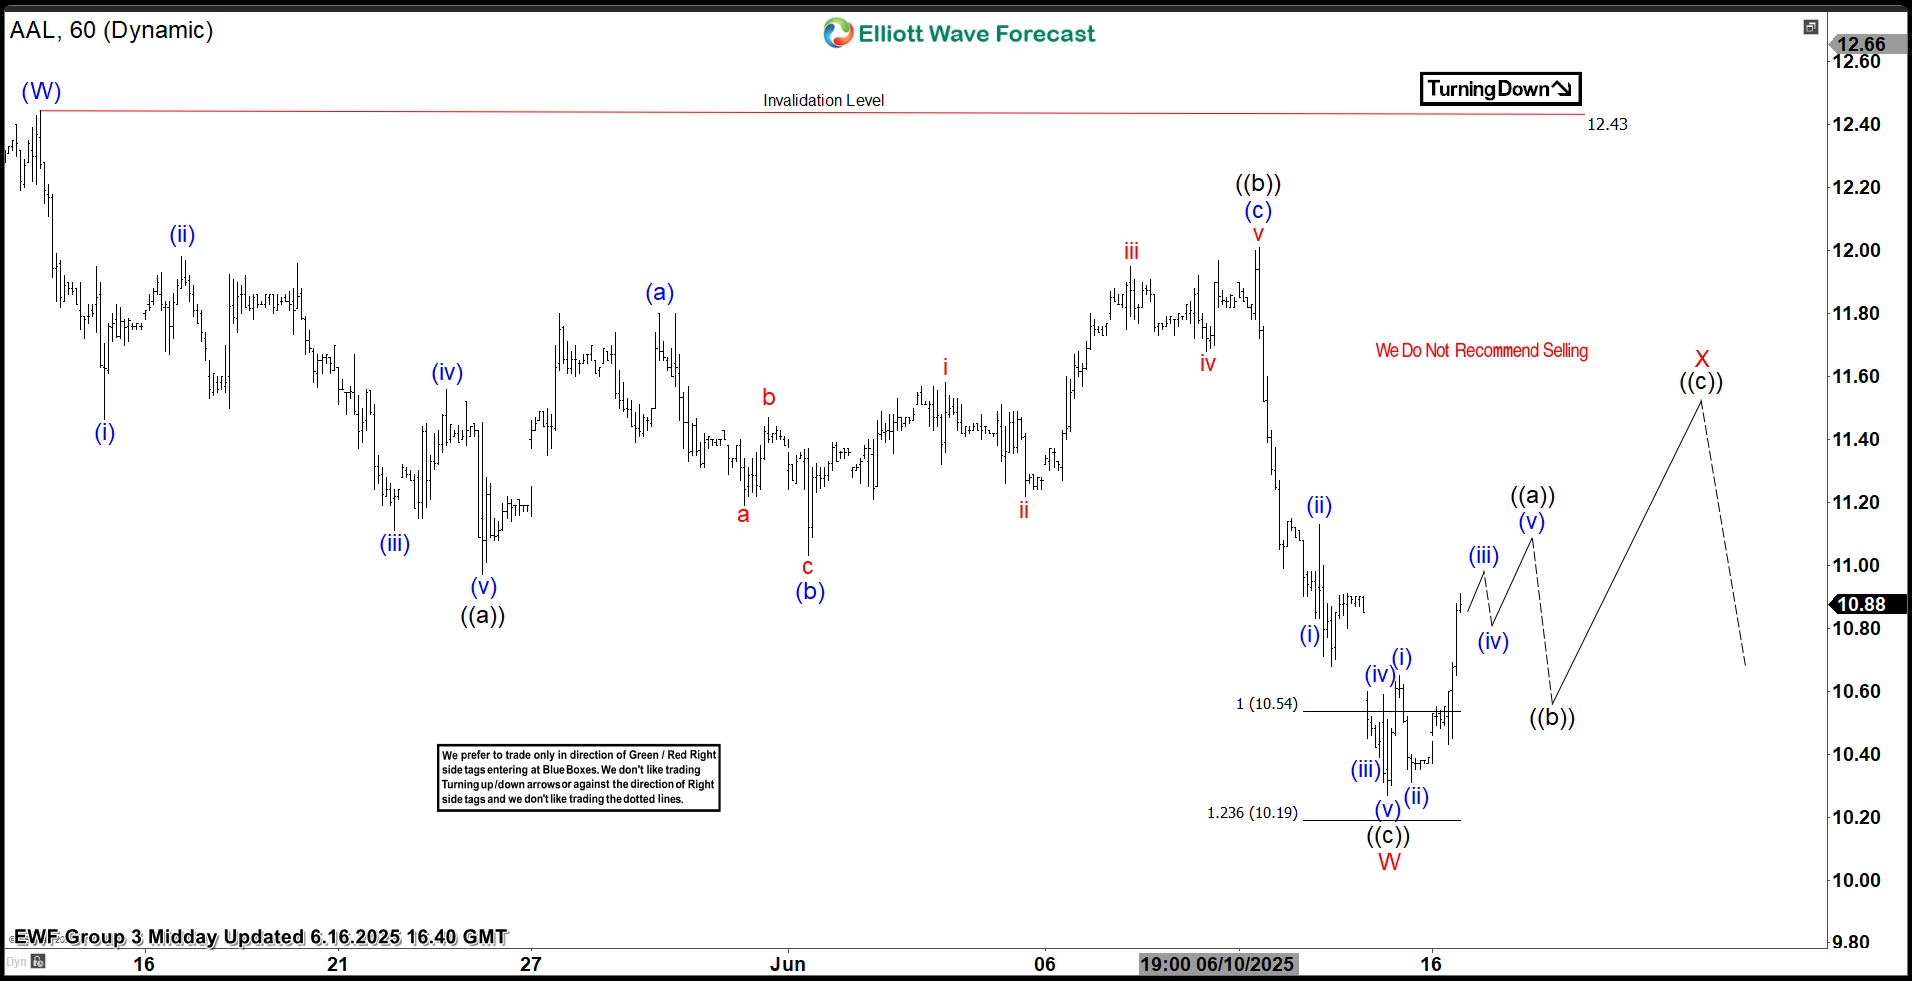
$AAL 1H Elliott Wave Chart 6.16.2025:
The recent update, from June 16, 2025, shows that the stock bounced as predicted. Currently, it is trading higher in wave X looking for 11.40–11.60 area before another pullback can happen.
Conclusion
In conclusion, our Elliott Wave analysis of American Airlines $AAL suggested that a bounce was due. As a result, traders that bought the extreme area should monitor the $11.40–$11.60 zone as the next potential target. In the meantime, keep an eye out for any corrective pullbacks that may offer entry opportunities. By applying Elliott Wave Theory, traders can better anticipate the structure of upcoming moves and enhance risk management in volatile markets.