Newmont Mining (ticker: NEM) is the world’s largest gold mining company, based in Greenwood Village, Colorado, United States. It has ownership of gold mines in Nevada, Colorado, Ontario, Quebec, Mexico, the Dominican Republic, Australia, Ghana, Argentina, Peru, and Suriname. Newmont is the only gold producer listed in the S&P 500 Index. The company is leading the miner sectors and close to break its previous all-time high in the year 1987 at $81.92. The stock made an intraday high of $80.75 earlier this month on March 8. Below we will look at the Elliott Wave chart of the company
NEM Monthly Elliott Wave Chart
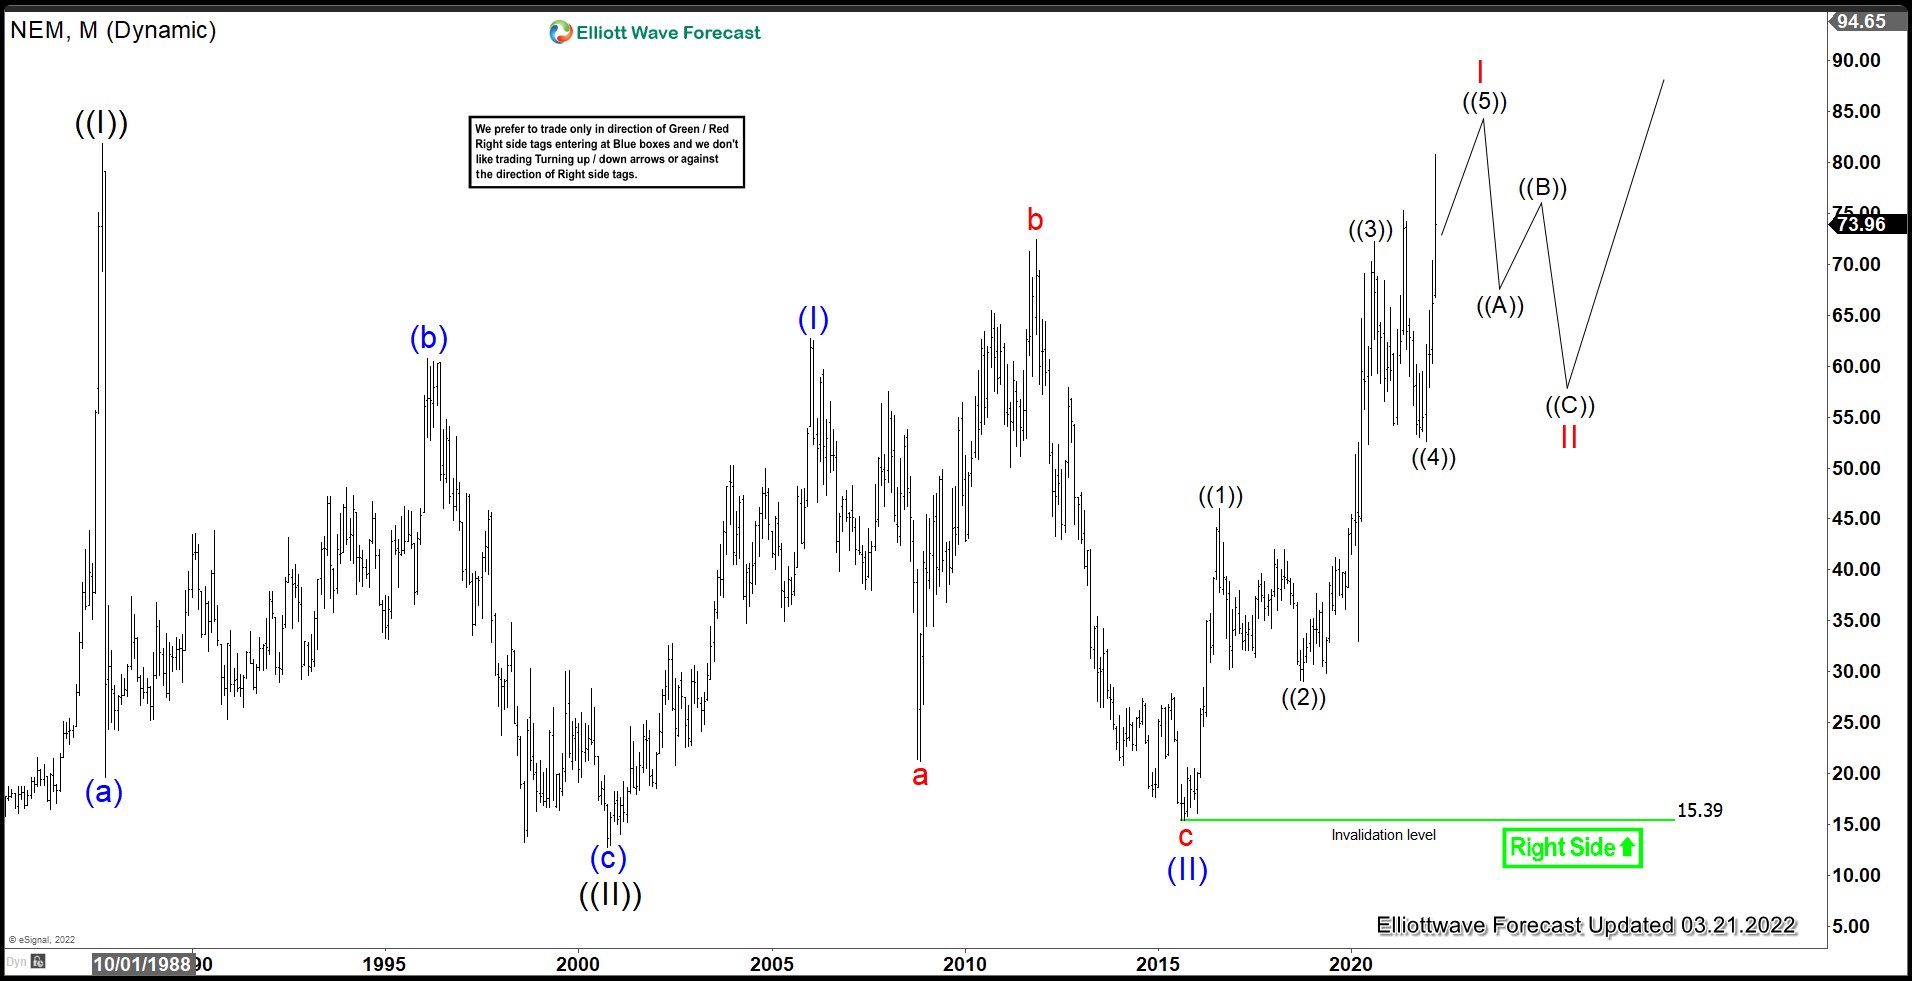
Monthly chart above goes back to as far as 1987 where the peak in 1987 at $81.92 ended wave ((I)) in grand super cycle degree. Wave ((II)) pullback ended at $12.75 in year 2000. The stock is currently within a larger grand super cycle wave ((III)) which subdivides into another 5 waves impulse. Up from wave ((II)), wave (I) ended at $62.72 on January 2006 and pullback in wave (II) ended at $15.39 on August 2015 low. Stock then rallies higher again in wave (III) of ((III)). Cycle from August 2015 low is expected to end soon in wave I as 5 waves impulse. Then the stock should pullback in wave II to correct cycle from August 2015 low before the rally resumes.
NEM Daily Elliott Wave Chart

Daily Elliott Wave Chart of Newmont mining (NEM) above suggests the stock may see 1 more push higher before ending wave ((5)). This would also complete wave I in higher degree and end cycle from August 2015 low. Stock can then see pullback in larger degree to correct the cycle from August 2015 low before the rally resumes. Pullback should offer an opportunity to buy the dips in 3, 7, or 11 swing for further upside.
Source: https://elliottwave-forecast.com/stock-market/newmont-mining-nem-leading-miners-upside/