
Cameco Corporation (CCJ) is one of the world’s largest uranium producers, headquartered in Saskatoon, Canada, and a key supplier of nuclear fuel used for electricity generation worldwide. With major mining operations such as Cigar Lake and McArthur River, along with strategic assets in fuel services and nuclear technology through Westinghouse, Cameco plays a central role in the global nuclear energy supply chain, benefiting from rising demand for clean, low‑carbon power.
Cameco ($CCJ) Monthly Elliott Wave Chart
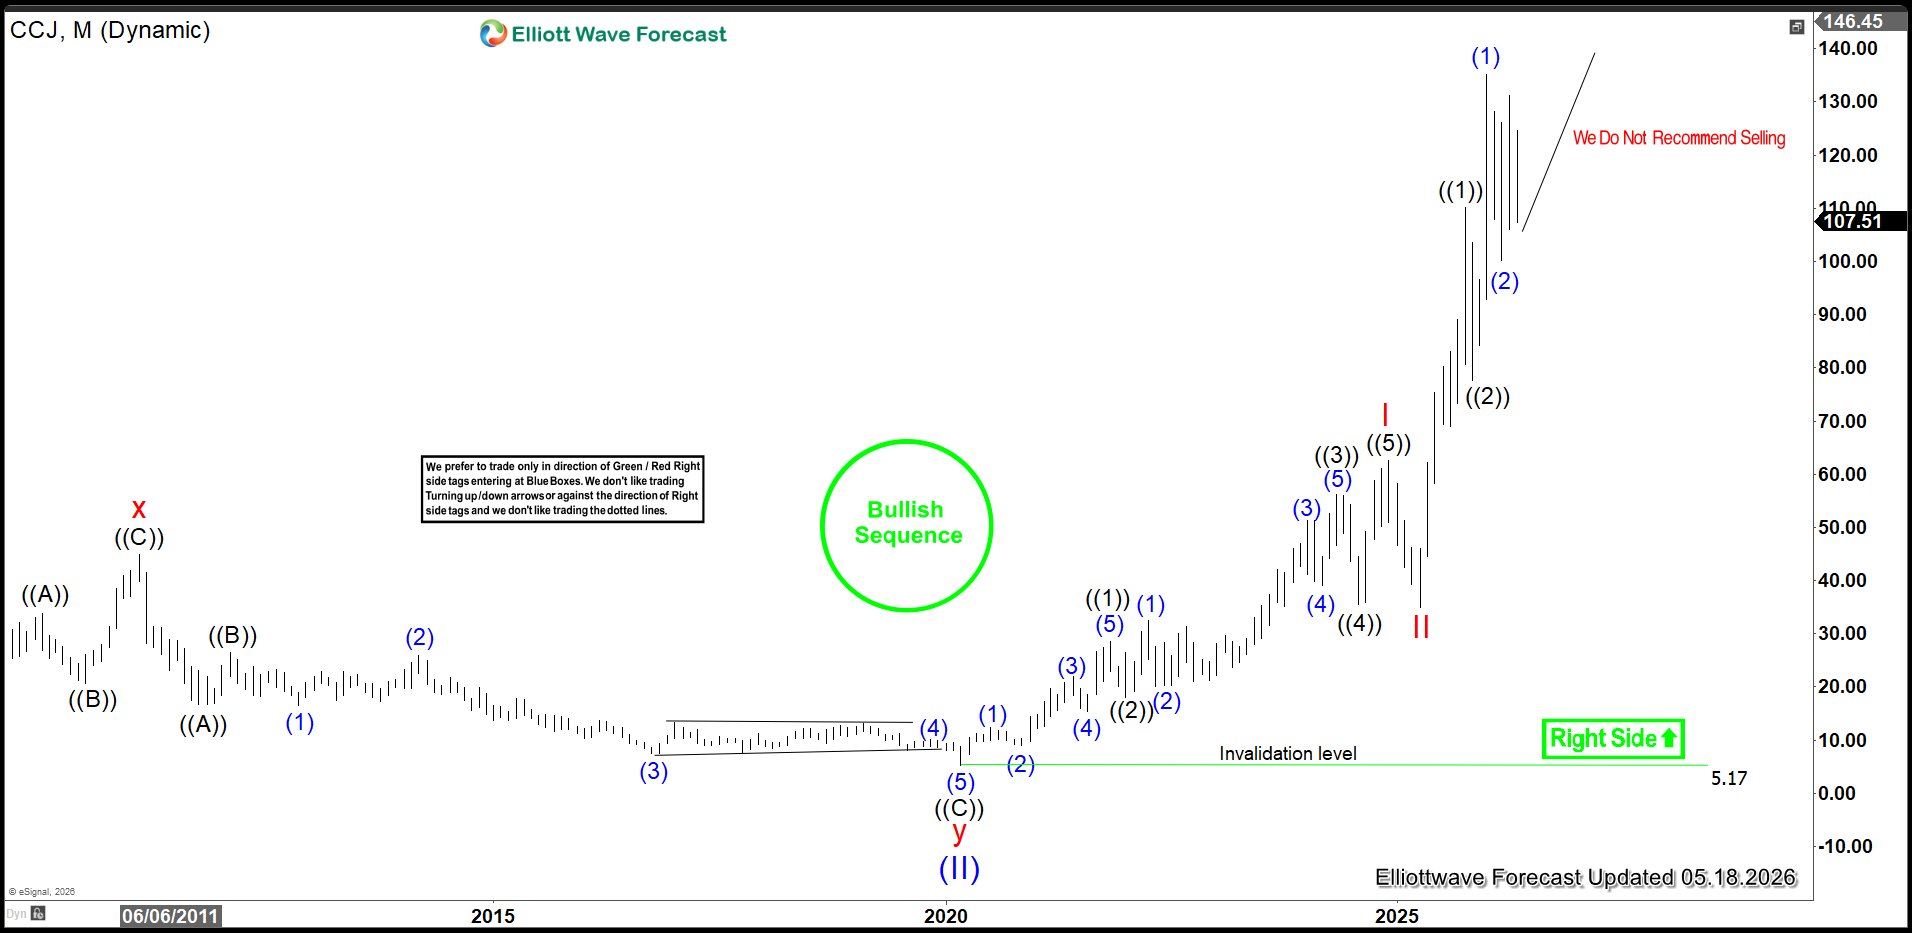
The monthly Elliott Wave chart for Cameco (CCJ) shows that wave (II) of the Super Cycle bottomed at $5.17 in March 2020. From that low, the stock launched into a powerful impulsive advance in wave (III), unfolding as a triple nest. Wave I of (III) peaked at $62.55, followed by a corrective wave II that retraced to $35. The next nesting sequence carried prices higher, with wave ((1)) topping at $110.16 and wave ((2)) pulling back to $77.70. The advance then resumed, with wave (1) of ((3)) of III reaching $96.57, and the subsequent wave (2) correction proposed complete at $100.11. As long as price holds above this level, CCJ is expected to continue extending higher within wave (III).
Cameco ($CCJ) Monthly Alternate Elliott Wave Chart
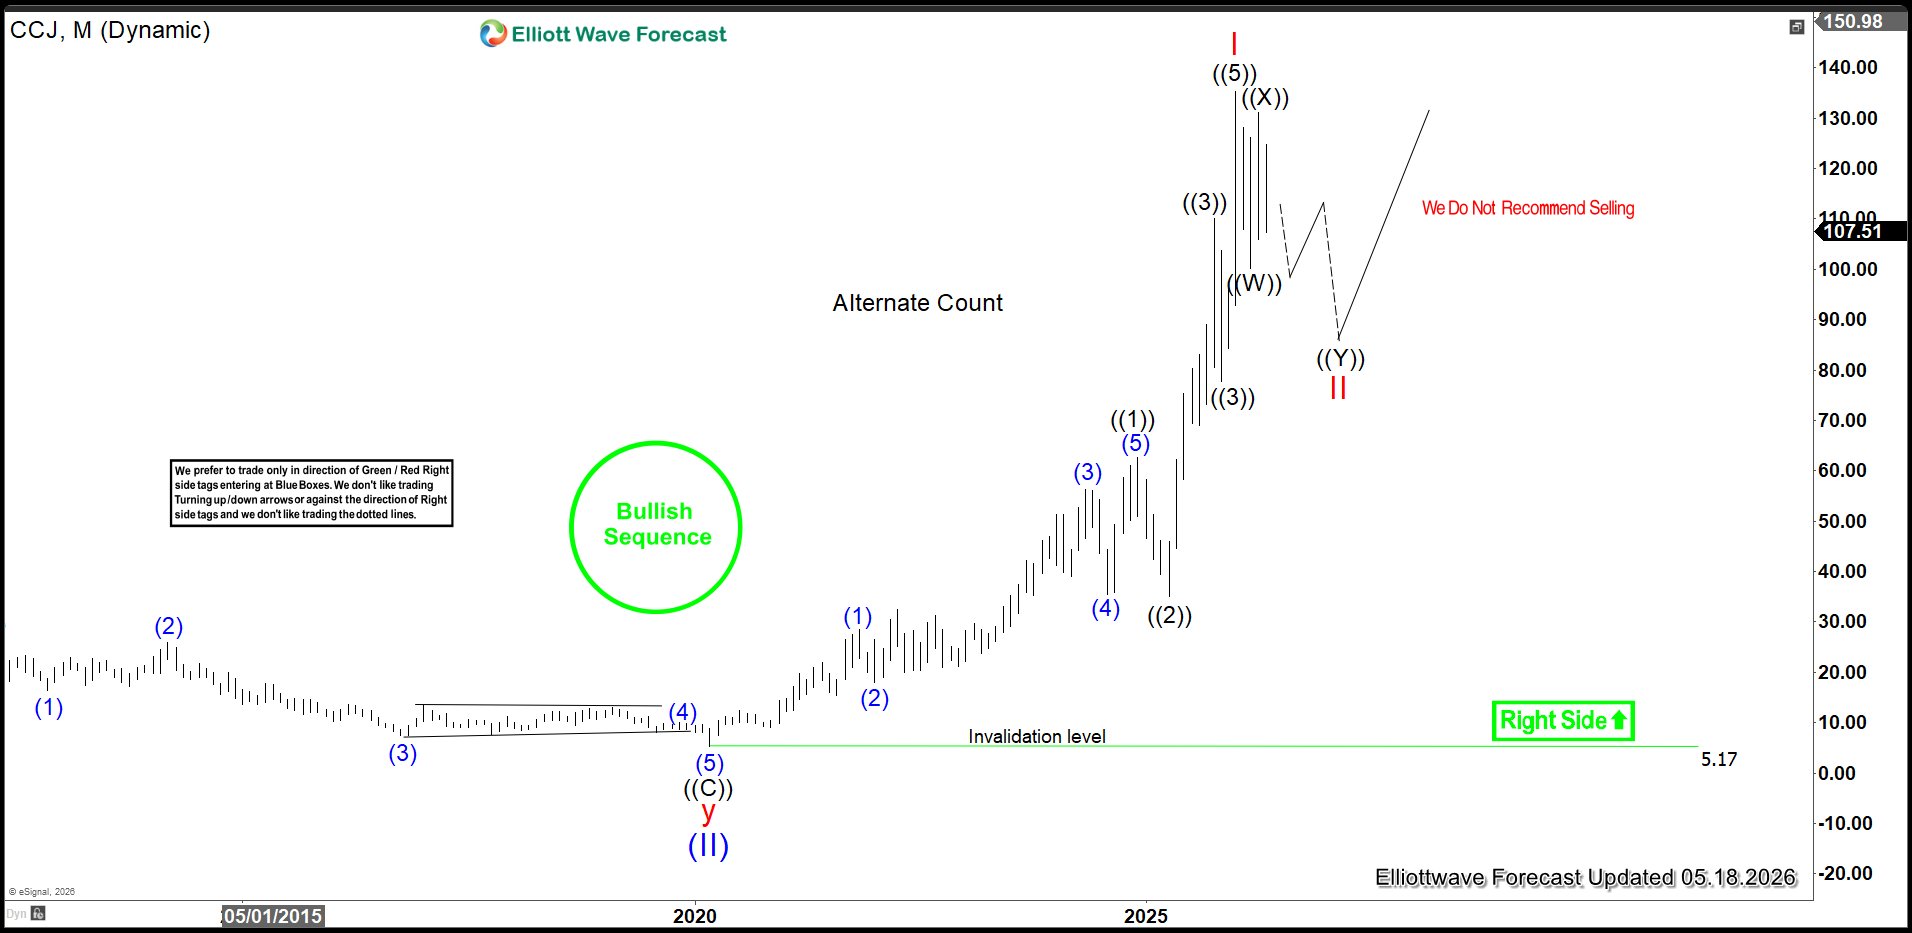
The monthly alternate Elliott Wave chart of Cameco (CCJ) suggests that the Super Cycle wave I concluded at $135.24. This completed a five‑wave advance from the March 2020 low. The stock is now positioned for a larger degree correction in wave II of the Super Cycle. It should unfold in either three or seven swings before resuming its upward trend. Within this alternate view, CCJ may decline toward the $74.60–$96.00 zone. This is the area where buyers are anticipated to emerge for renewed strength or at least a three‑wave rally. This area aligns with the 100%–161.8% Fibonacci extension of wave ((Y)) relative to wave ((W)).
$CCJ Daily Elliott Wave Chart
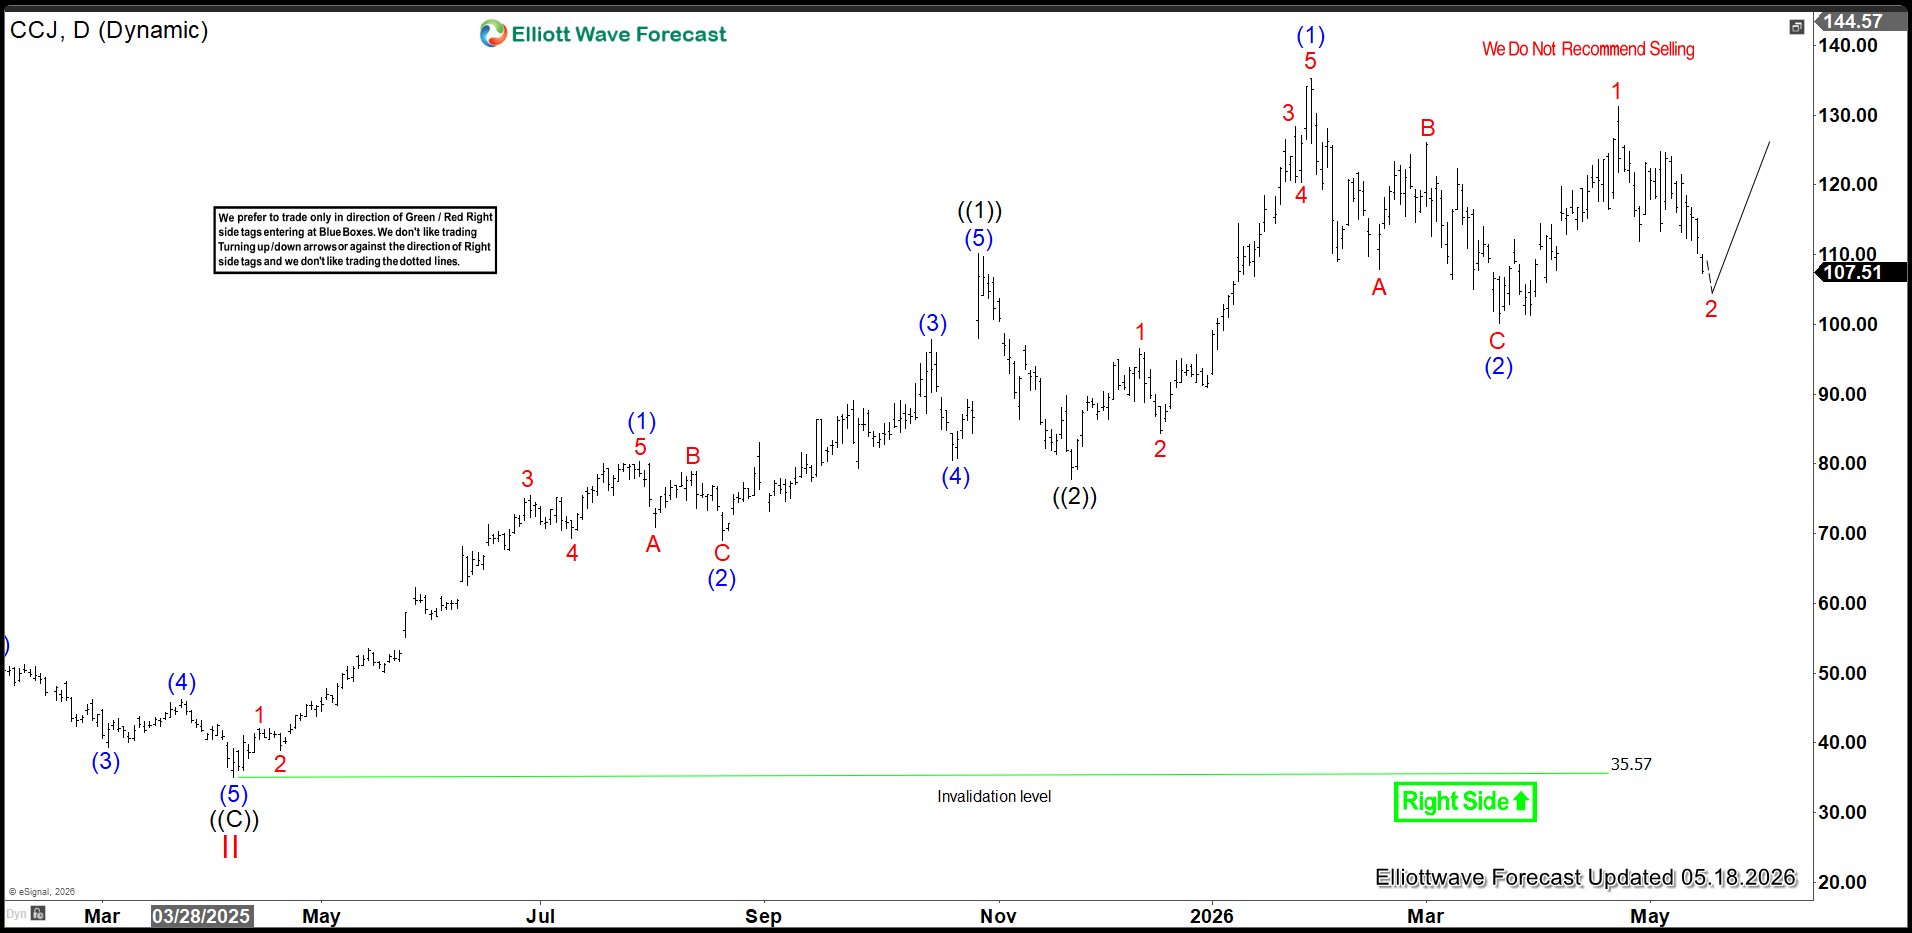
The daily Elliott Wave chart of Cameco (CCJ) shows the primary view that the ETF is advancing in a triple nest from the March 2020 low. Wave II completed at $35.57, setting the stage for a strong rally in wave III in a nested sequence. From the wave II low, wave ((1)) peaked at $110.16, followed by a corrective wave ((2)) that ended at $77.70. The next advance carried CCJ higher with wave (1) reaching $135.24. The subsequent pullback in wave (2) completed at $100.11. As long as price holds above $100.11, the ETF is expected to find support and continue higher. A break below $100.11, however, would signal that the alternate scenario outlined earlier is in play.
Source: https://elliottwave-forecast.com/stock-market/cameco-ccj-may-see-short-term-support-soon/