Home Depot (NYSE: HD), the largest U.S. home improvement retailer, will report quarterly earnings tomorrow. The company’s performance often serves as a barometer for economic conditions because of its exposure to spending, housing activity, and construction demand. Over the past year, Home Depot has faced elevated interest rates, slowing home sales, and cautious discretionary spending. These factors have weighed on renovation projects. Despite the challenges, the retailer continues to benefit from strong market leadership, a robust contractor business, and steady demand for essential maintenance products.
Analysts and investors will closely monitor comparable store sales, consumer traffic, margins, and forward guidance. Particular emphasis will be placed on whether demand is stabilizing after several quarters of softer home improvement activity. A stronger-than-expected report could signal improving consumer confidence and renewed housing-related spending, potentially lifting sentiment across retail and housing sectors. Conversely, weaker guidance or declining sales may reinforce concerns that high borrowing costs and economic uncertainty remain significant headwinds. As a result, Home Depot’s earnings release may serve as an important indicator not only for the company but also for the broader U.S. economy.
From a technical perspective, the Elliott Wave outlook remains constructive for Home Depot ($HD). Within the Grand Super Cycle degree, the stock has advanced in an impulsive sequence or potentially a bullish nest since the lows of the financial crisis. Both the primary and alternate counts suggest that the current decline represents a larger corrective phase. We labelled the pullback as wave (IV), unfolding within a High-Frequency Blue Box area. From this region, the expectation is for the stock to resume its broader bullish trend and ultimately reach new all-time highs into 2026.
Home Depot (HD) Quarterly Elliott Wave Chart
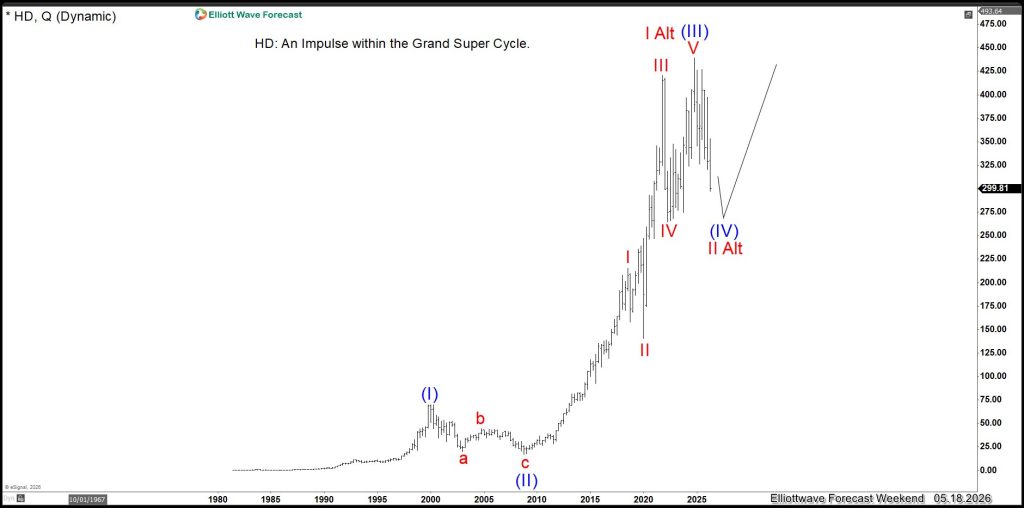
Under Elliott Wave Theory, an impulse consists of a five-wave structure in the direction of the main trend. Waves 1, 3, and 5 subdivide into five waves. Meanwhile waves 2 and 4 unfold as corrective patterns against the trend. At the moment, Home Depot appears to be finishing wave (IV), which is taking shape as a simple ABC correction. Typically, this structure follows a 5-3-5 internal sequence. In addeition, it tends to terminate near the 100%–161.8% Fibonacci extension of waves ((A)) and ((C)). The current decline has now entered that key extension zone, reinforcing the probability that the correction is approaching completion.
The following chart highlights the wave (IV) structure together with the High-Frequency Blue Box buying area. Historically, these regions have provided high-probability reaction zones where institutional buyers tend to re-enter the market. While Elliott Wave Theory is often criticized for its subjectivity, our approach combines sequence analysis, High-Frequency Blue Boxes, and a proprietary pivot system to improve trend validation and identify statistically favorable areas.
Home Depot Weekly Elliott Wave Chart
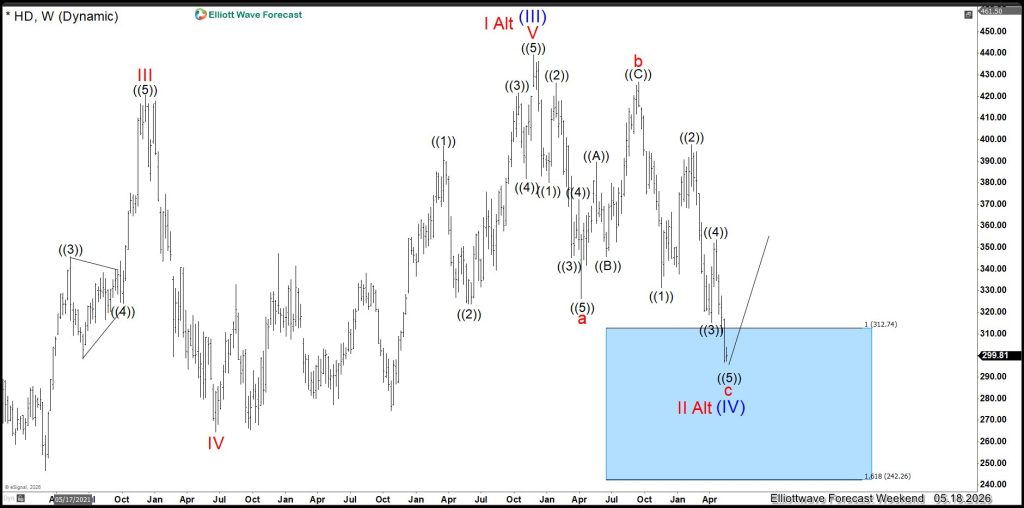
As a result, buying Home Depot ahead of earnings while the stock trades within this support zone offers a favorable risk-to-reward profile. At minimum, the setup favors a meaningful bounce, while the larger bullish scenario suggests the possibility that the next major rally toward new all-time highs may already be beginning.