
On February 12/2021 EURNZD was showing bearish market patterns that was signalling traders that there was a high probability that the pair could make a move lower. The pair has been trending and moving lower since the March 2020 peak high and we at EWF always advise our members to trade with the trend and not against it.
The charts below will clearly show the various bearish market patterns that signalled traders to get in the market and that EURNZD would continue on its bearish trend lower.
EURNZD 1 Hour Chart February 12 2021 (Pattern 1)
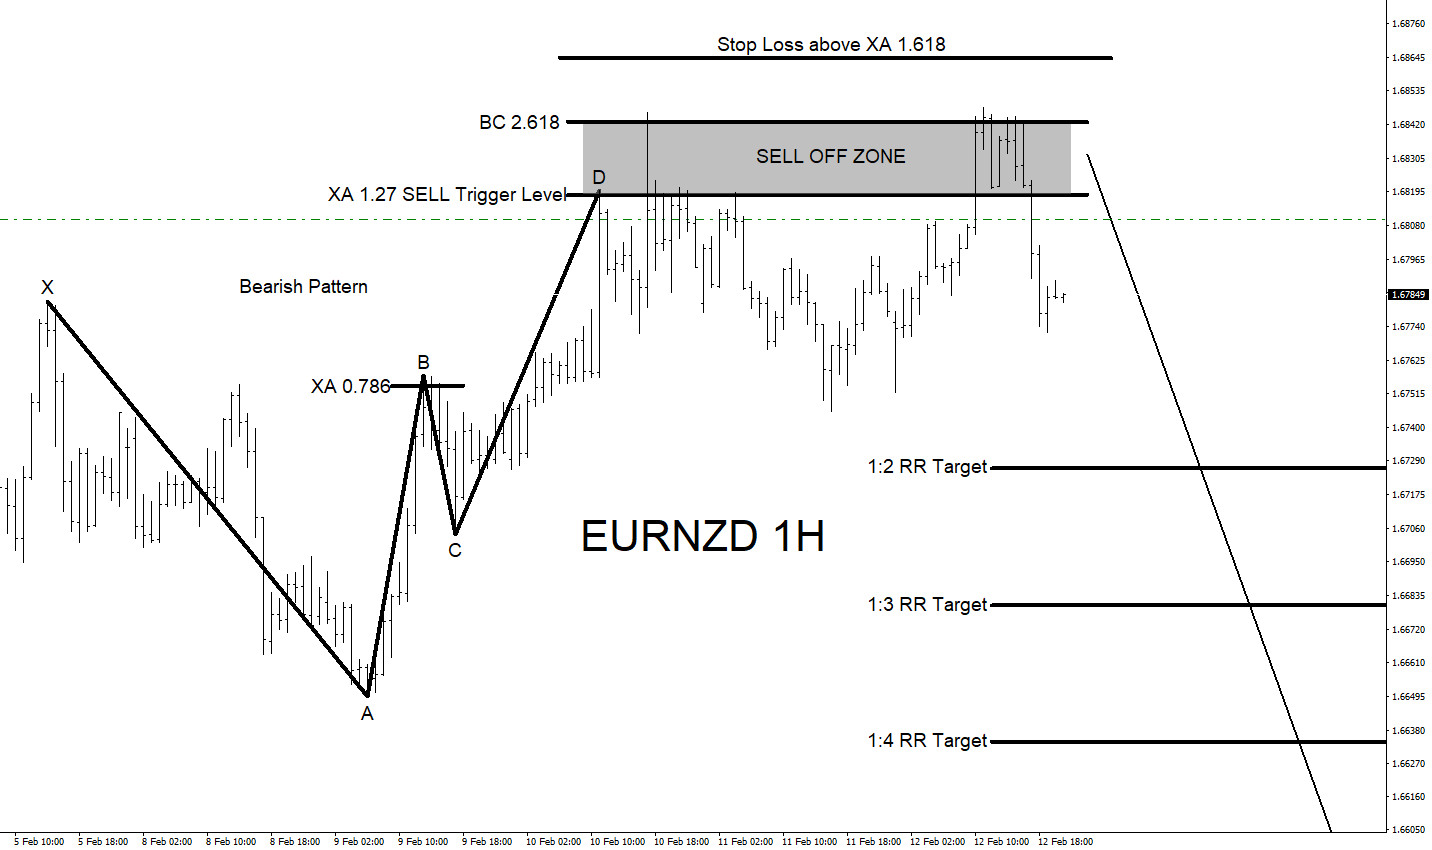
Bearish market pattern 1 formed signalling traders that the pair would move lower from the XA 1.27% – BC 2.618% Fib. retracement levels. Only a move above the XA 1.618% would invalidate the market pattern. Targets were considered based on the XA 1.27% SELL trigger level and the XA 1.618% invalidation level.
EURNZD 1 Hour Chart February 12 2021 (Pattern 2)
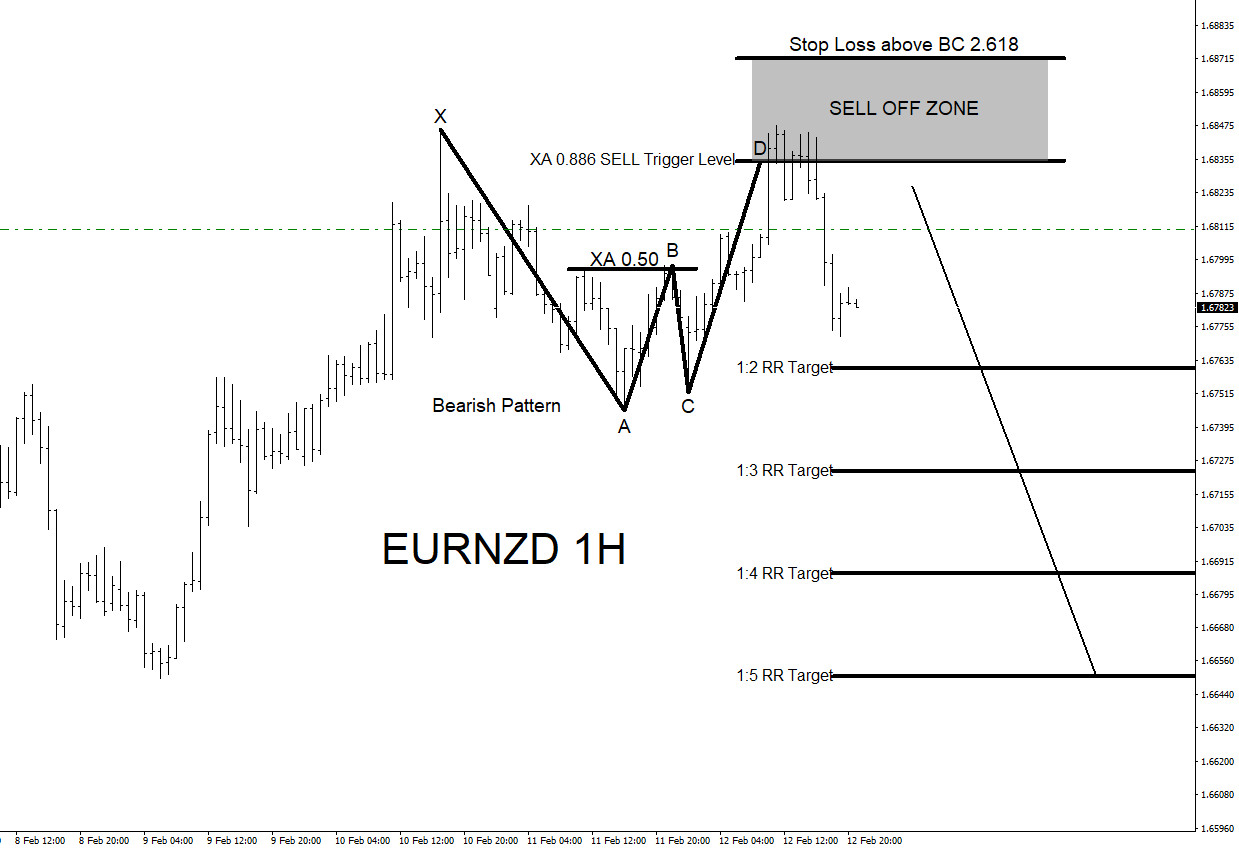
Bearish market pattern 2 formed signalling traders that the pair would move lower from the XA 0.886% – BC 2.618% Fib. retracement levels. Only a move above the XA 2.618% would invalidate the market pattern. Targets were considered based on the XA 0.886% SELL trigger level and the BC 2.618% invalidation level.
EURNZD 1 Hour Chart February 12 2021 (Pattern 3)
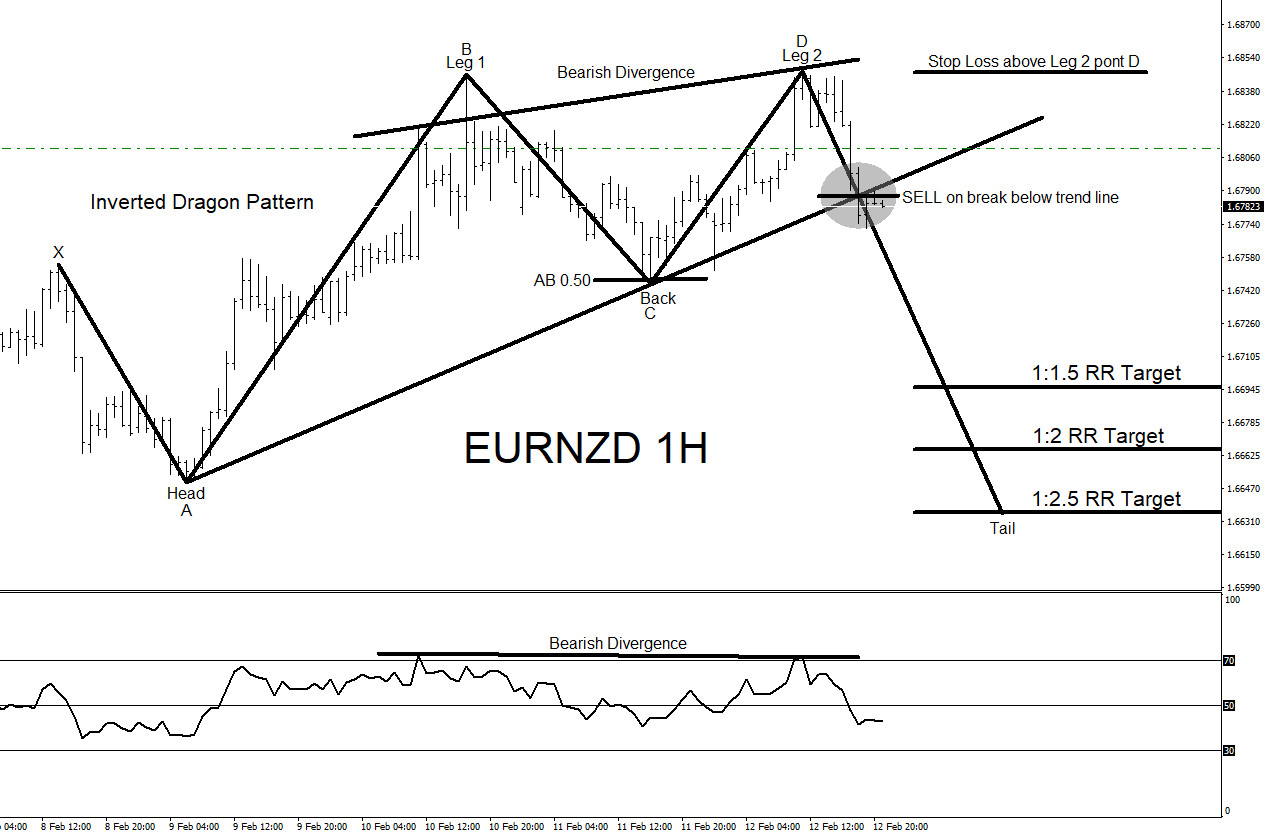
Bearish market pattern 3 formed signalling traders that the pair would move lower from the break of the A to C trend line. Only a move above the point D would invalidate the market pattern. Targets were considered based on the SELL trend line break and the point D invalidation level.
EURNZD 1 Hour Chart February 12 2021 (Support/Resistance Zone & Bearish Divergence)

A bearish wedge breakout pattern formed and bearish market patterns 1 (purple) & 2 (green) triggered SELLS in the support/resistance zone. Also bearish divergence formed in the same support/resistance zone signalling traders that the zone was a good selling area.
EURNZD 1 Hour Chart February 19 2021 (Pattern 4)

A bearish descending triangle pattern 4 (blue) forms and price breaks below triangle signalling traders again that more sellers are getting in the market.
EURNZD eventually moves lower and hits my 1:2 RR target at 1.6610 from the 1.6810 sell entry for a +200 pip move.
Source: https://elliottwave-forecast.com/aidans-corner/eurnzd-bearish-market-patterns-signalling-move-lower/