
In this technical blog, we will look at the past performance of the 1-hour Elliott Wave Charts of DXY. We presented to members at the elliottwave-forecast. In which, the decline from 21 November 2025 high unfolded as an impulse structure. And showed a lower low favored more downside extension to take place. Therefore, we advised members not to buy the US dollar & sell the bounces in 3, 7, or 11 swings. Based on Elliott wave hedging area looking to get 3 wave reaction lower at least. We will explain the structure & forecast below:
DXY 1-Hour Elliott Wave Chart From 1.22.2026
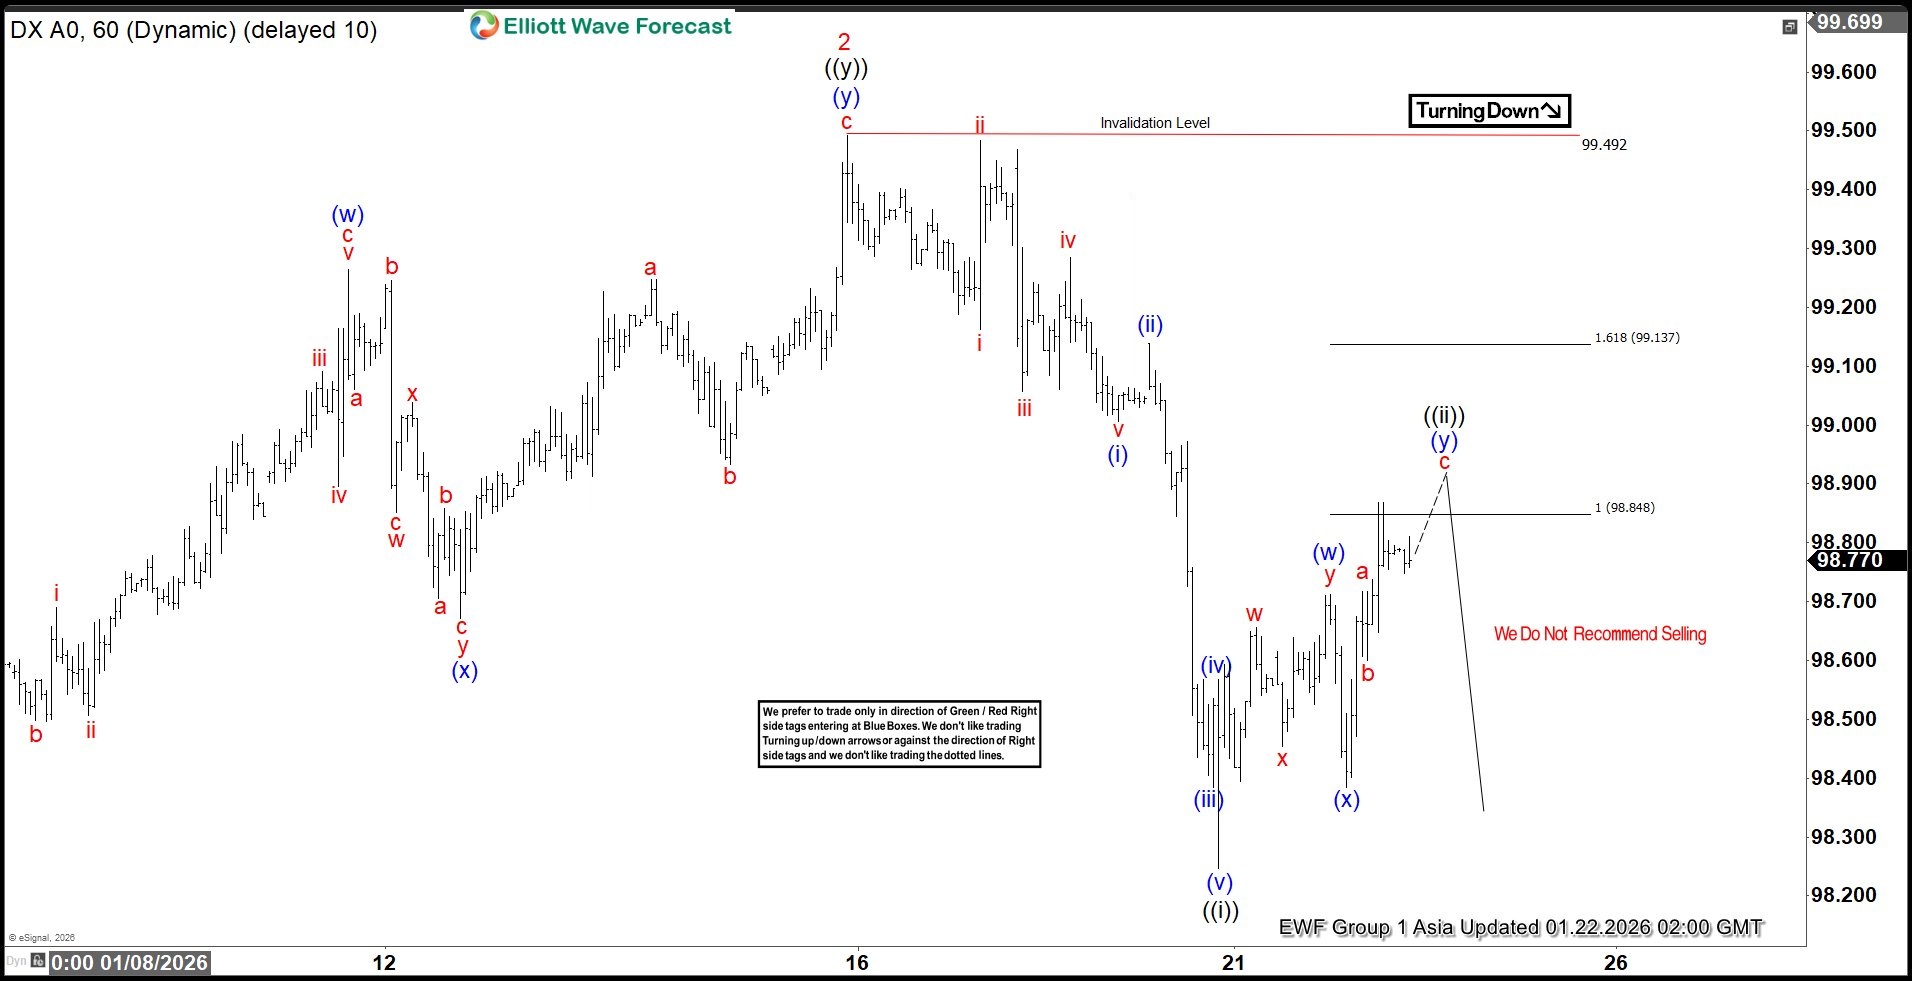
Here’s the 1-hour Elliott wave chart from the 1.22.2026 Asia update. In which, the decline to $98.24 low ended in wave ((i)) as an impulse structure. Up from there, the US dollar made a bounce higher in wave ((ii)) to correct that cycle. The internals of that pullback unfolded as Elliott wave double three structure & managed to reach the extreme equal legs area at $98.84- $99.13. From there, market makers agrees for the minimum reaction lower to take place.
DXY 1-Hour Elliott Wave Chart From 1.26.2026
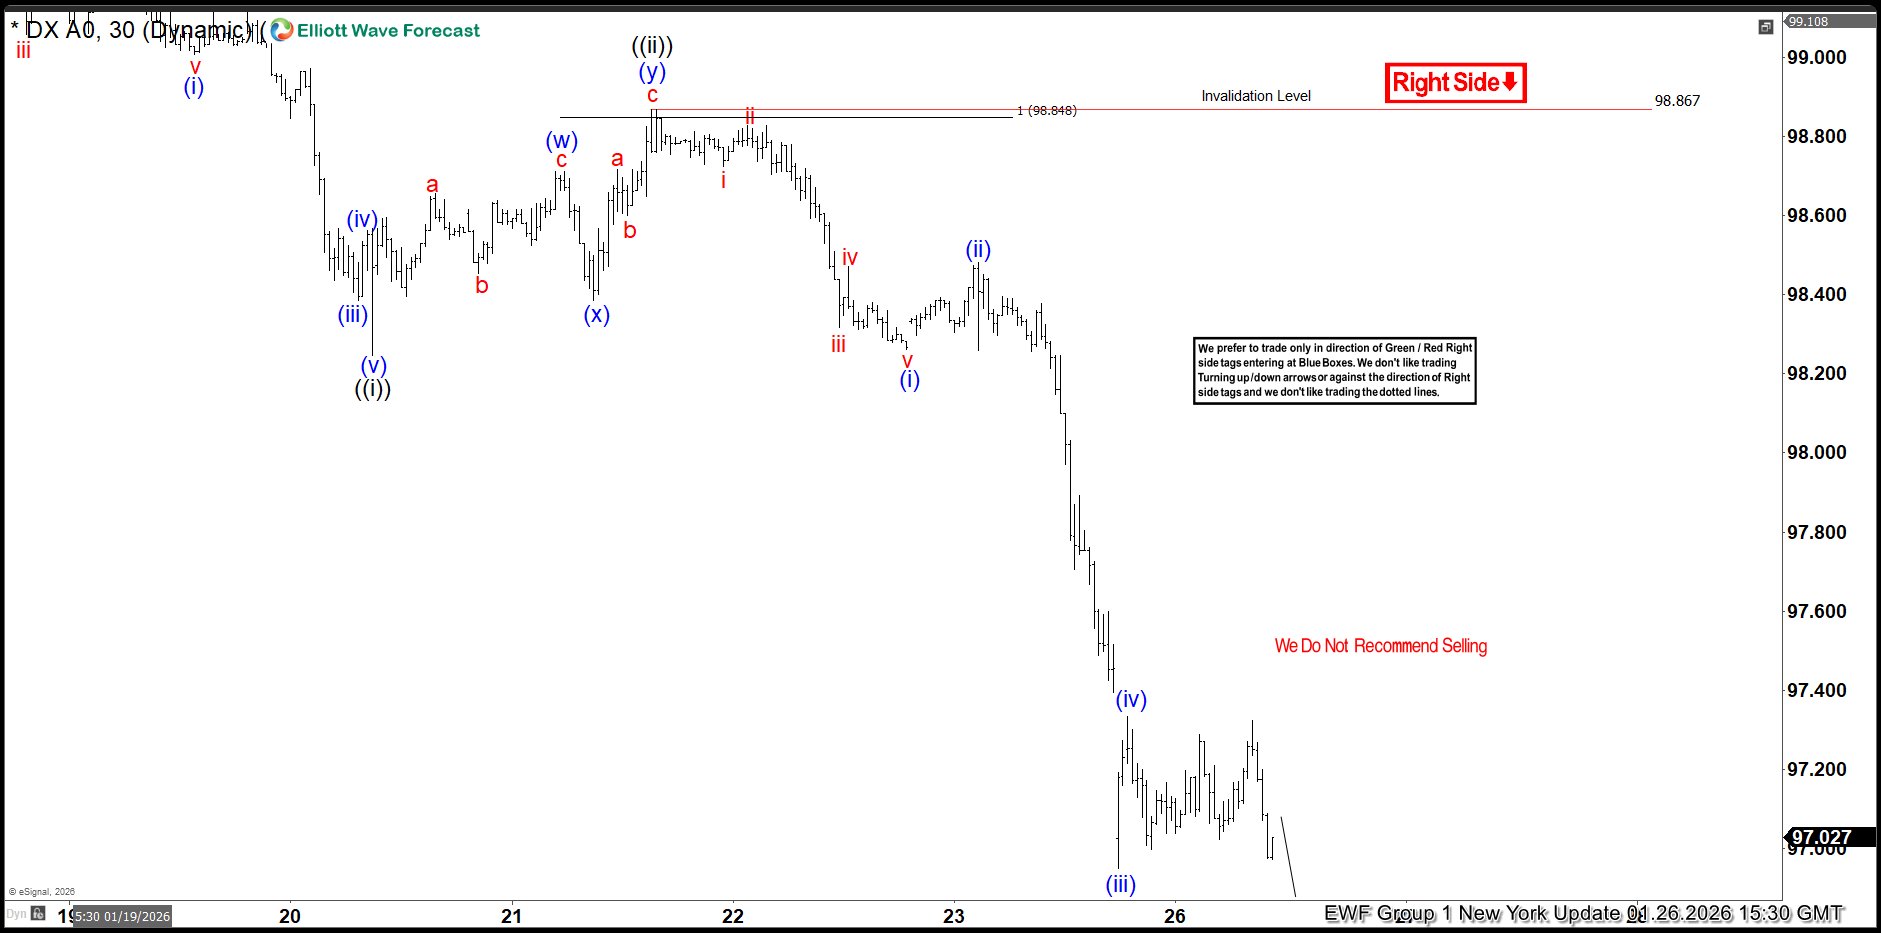
This is the 1-hour Elliott wave Chart from 1.26.2026 NY update. In which the DXY is showing a strong reaction lower taking place, right after ending the correction within the equal legs area. Allowed members to create a risk-free position shortly after taking the short position. Since then, the index has already made a new low below September 2025 low confirming the next leg lower.
Source: https://elliottwave-forecast.com/forex/dxy-faces-persistent-selling/