Nokia is a Finnish multinational telecommunications, consumer electronics and information technology company. Founded 1865, it is headquartered in Espoo, Finland. Investors can trade it under the ticker $NOKIA at Nasdaq Nordic OMX and at Euronext Paris. The company is a part of Euro Stoxx 50 (SX5E) index. Also, one can trade Nokia under the ticker $NOK in US in form of ADRs. Today, Nokia is employing more than 100’000 people, it is doing business in more than 130 countries and it is the world’s third-largest network equipment manufacturer.
Unfortunately for long-term investors, after bursting of the telecom bubble, the Nokia stock price fell from above 60 down to 1.30. As a matter of fact, during 12 subsequent years, it has lost 98% of its value. From 2012, the mammoth of the telecommunications industry is in the primary stages to rise again. Based on the the bullish patterns of the Nasdaq index in US and the TecDax index in Germany, technology sector should continue to remain strong. Indeed, this should provide support to $NOKIA for more upside. Hereby, investors can be looking to buy Nokia at a very attractive price with an expectation for a rally in the coming years.
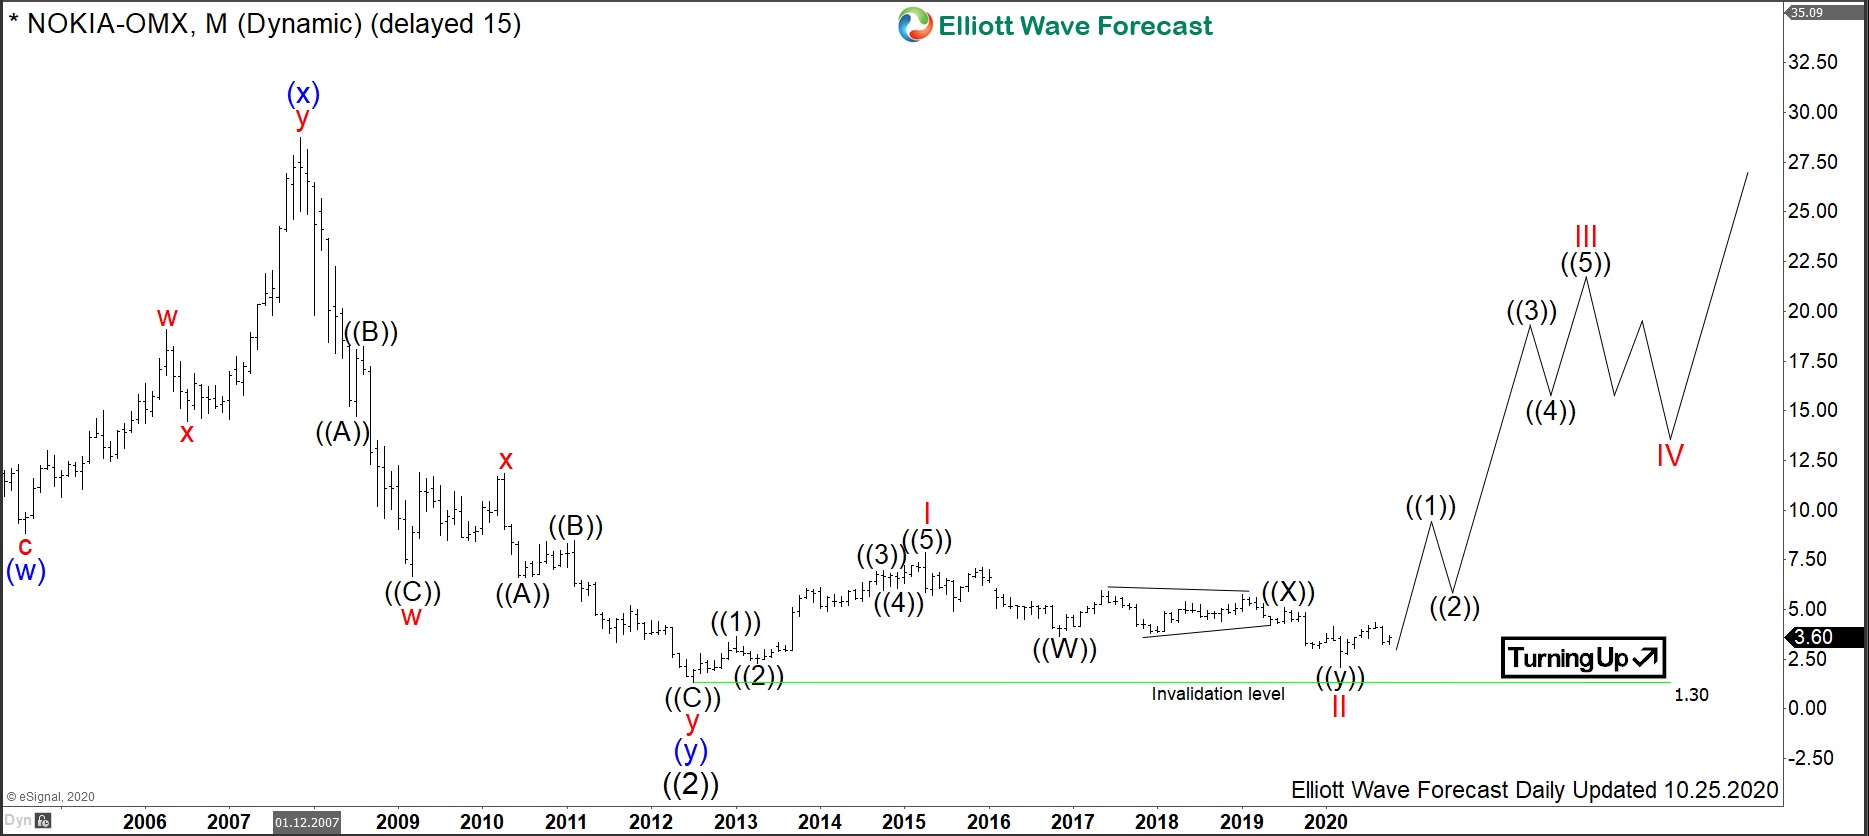
Nokia Monthly Elliott Wave Analysis 10.25.2020
The monthly chart below shows the Nokia shares $NOKIA traded at Nasdaq Nordic OMX Exchange. From the July 2012 lows at 1.30, the stock price has developed a cycle higher in wave I towards 7.86 highs on April 2015. After the primary impulse higher, a double three correction lower in wave II has ended on March 2020 at 2.08.
From the March lows, a new cycle in wave III of (I) may have started to the new highs. Break of 7.86 highs would confirm that. As of right now, the price is turning up against 2.08 lows in a black wave ((1)) of III. While abobe there, the target for wave III is 8.66-12.72 area and even higher.
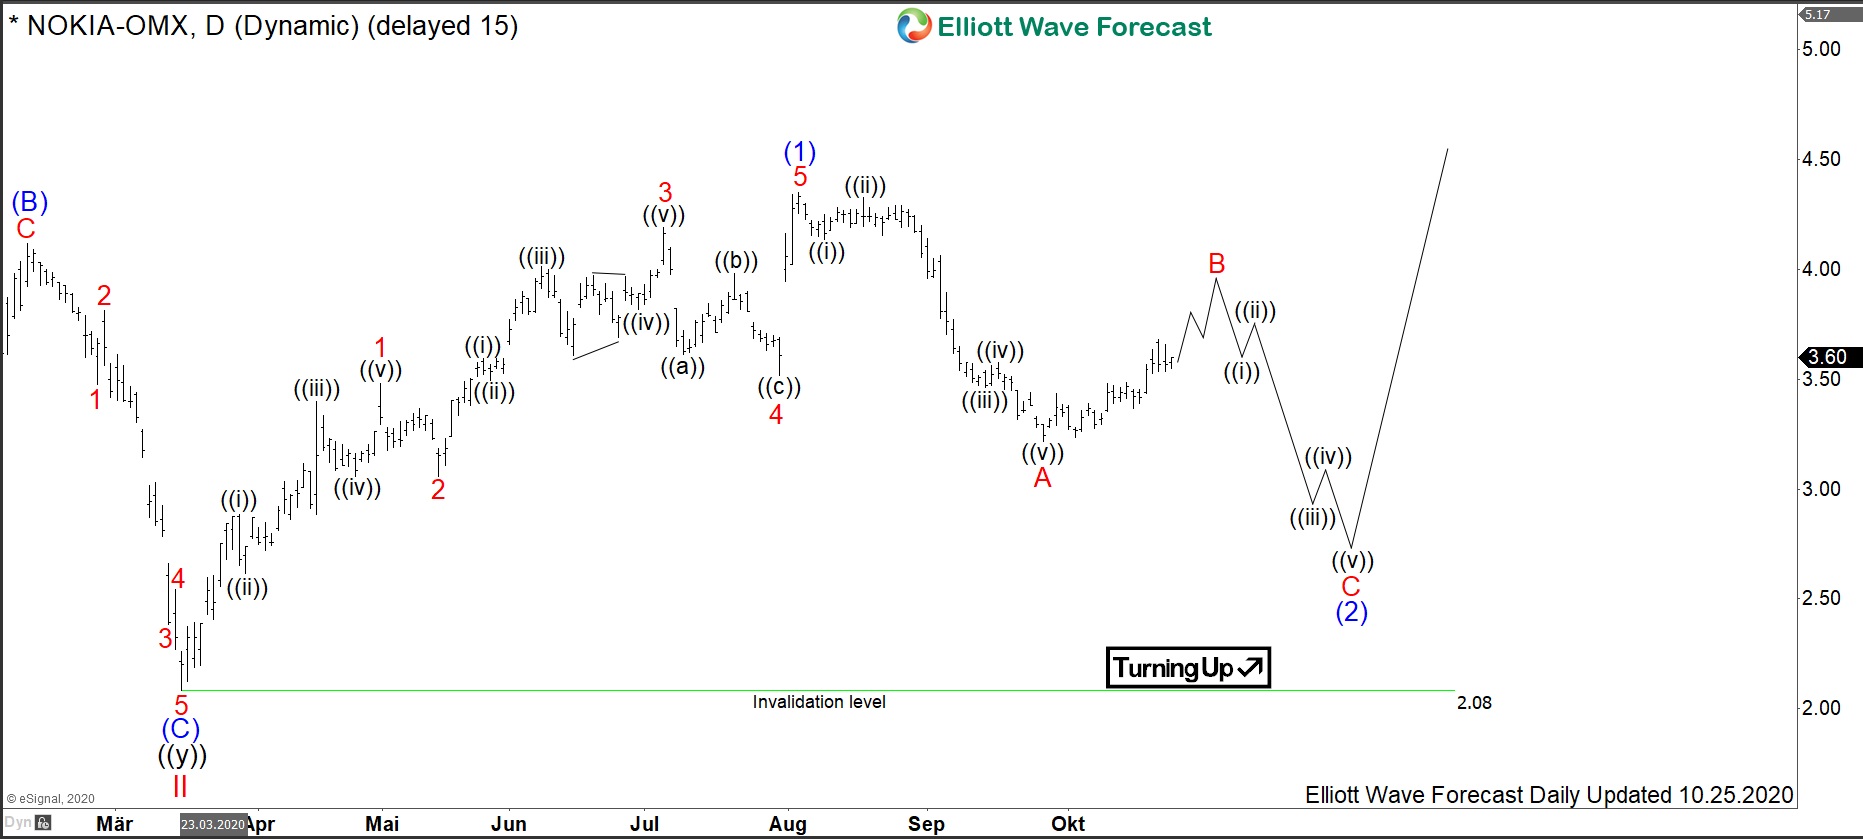
Nokia Daily Elliott Wave Analysis 10.25.2020
The daily chart below shows the $NOKIA shares price action in more detail. From the March 2020 lows at 2.08, the stock price has advanced in a blue wave (1) of black wave ((1)) towards August highs at 4.35. From the top, a decline in 5 waves of red wave A of (2) has ended. Consequently, expect wave (2) to develop as a zigzag pattern being a 5-3-5 structure. Currently, a bounce in wave B of (2) is unfolding. It should fail below the August highs for another leg in red wave C lower. The pullback in blue wave (2) should find buyers above the March lows at 2.08 for another extension higher in wave (3) of ((1)).
As an outlook, investors in technology may be looking for an opportunity to buy $NOKIA in a pullback against 2.08 lows with a potential towards 8.66-12.72 area and higher in the coming years.