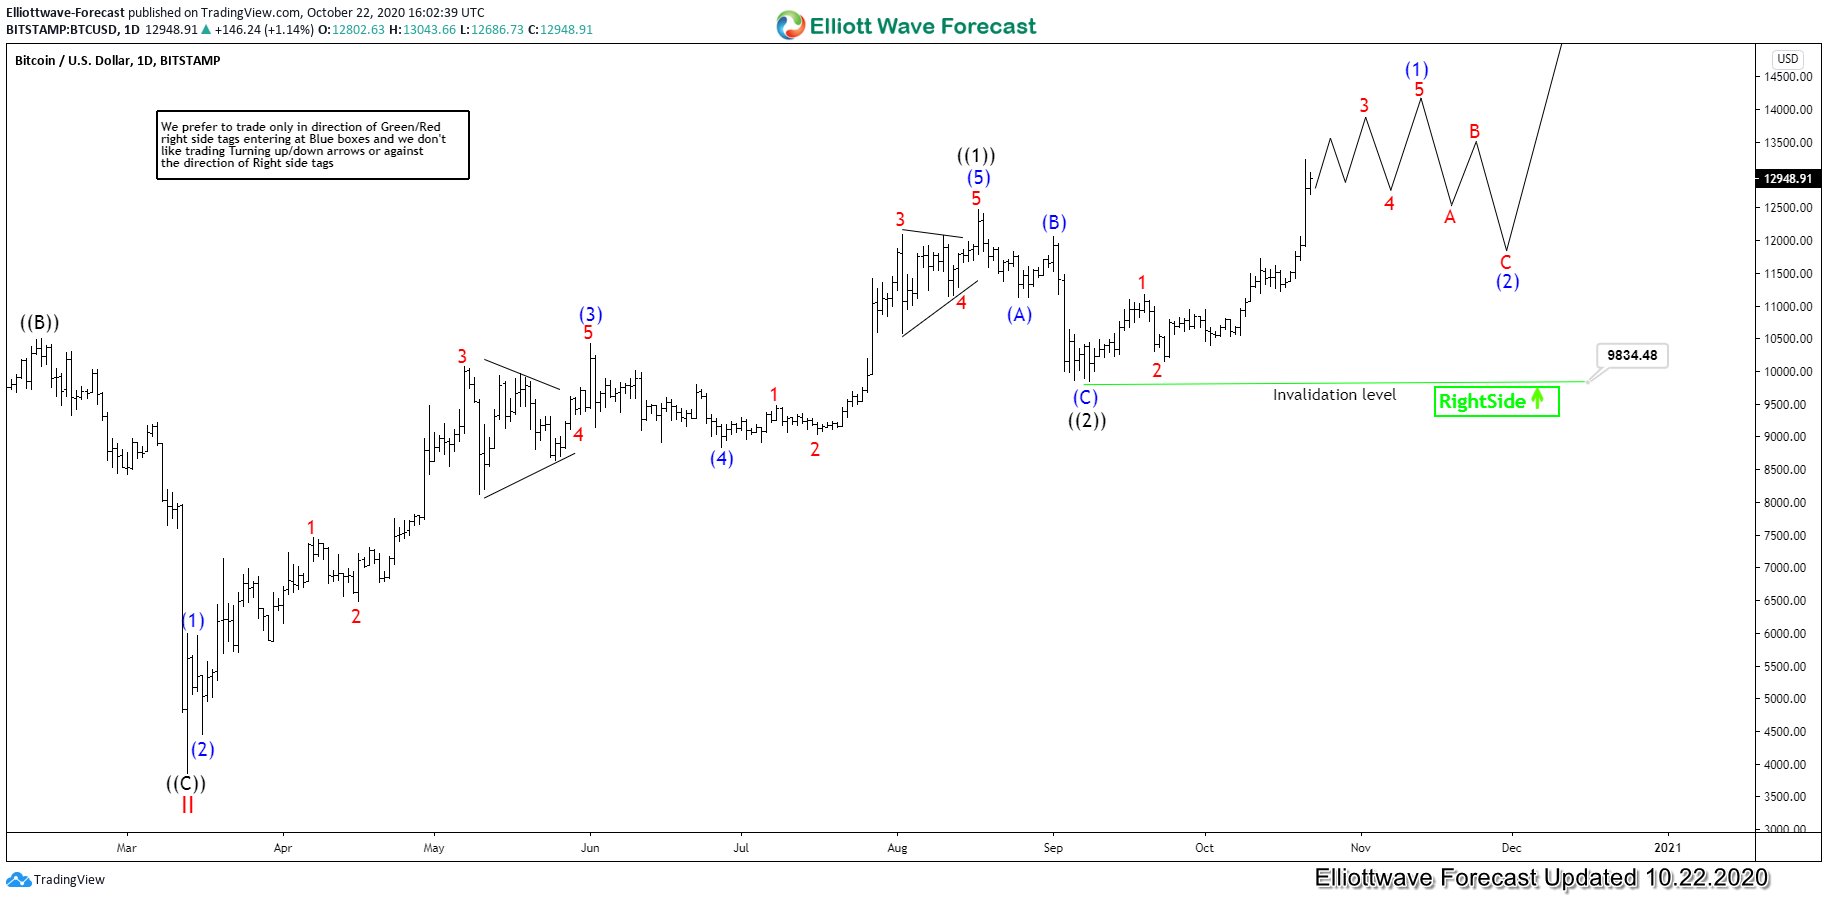
Bitcoin has been rallying for the last few weeks and this week it managed to make a new high above August 17, 2020 peak. The low seen on 8th September 2020 was $9825 and this week’s high is $13235 which makes it $3410 and equates to 34.7% rally since 8th September 2020. In today’s article, we will look at the Elliott wave picture for Bitcoin to conclude what should be next for this major and most popular cryptocurrency. However, before we look at the Elliott wave structure of Bitcoin in detail, we need to understand that Bitcoin trades against US Dollar and so does the yellow metal (Gold). We believe in the concept of one market and hence why we will try to get clues from the chart of Gold to get more conviction in the future path of Bitcoin.
Bitcoin Elliott Wave View: Wave (1) of ((3)) in Progress