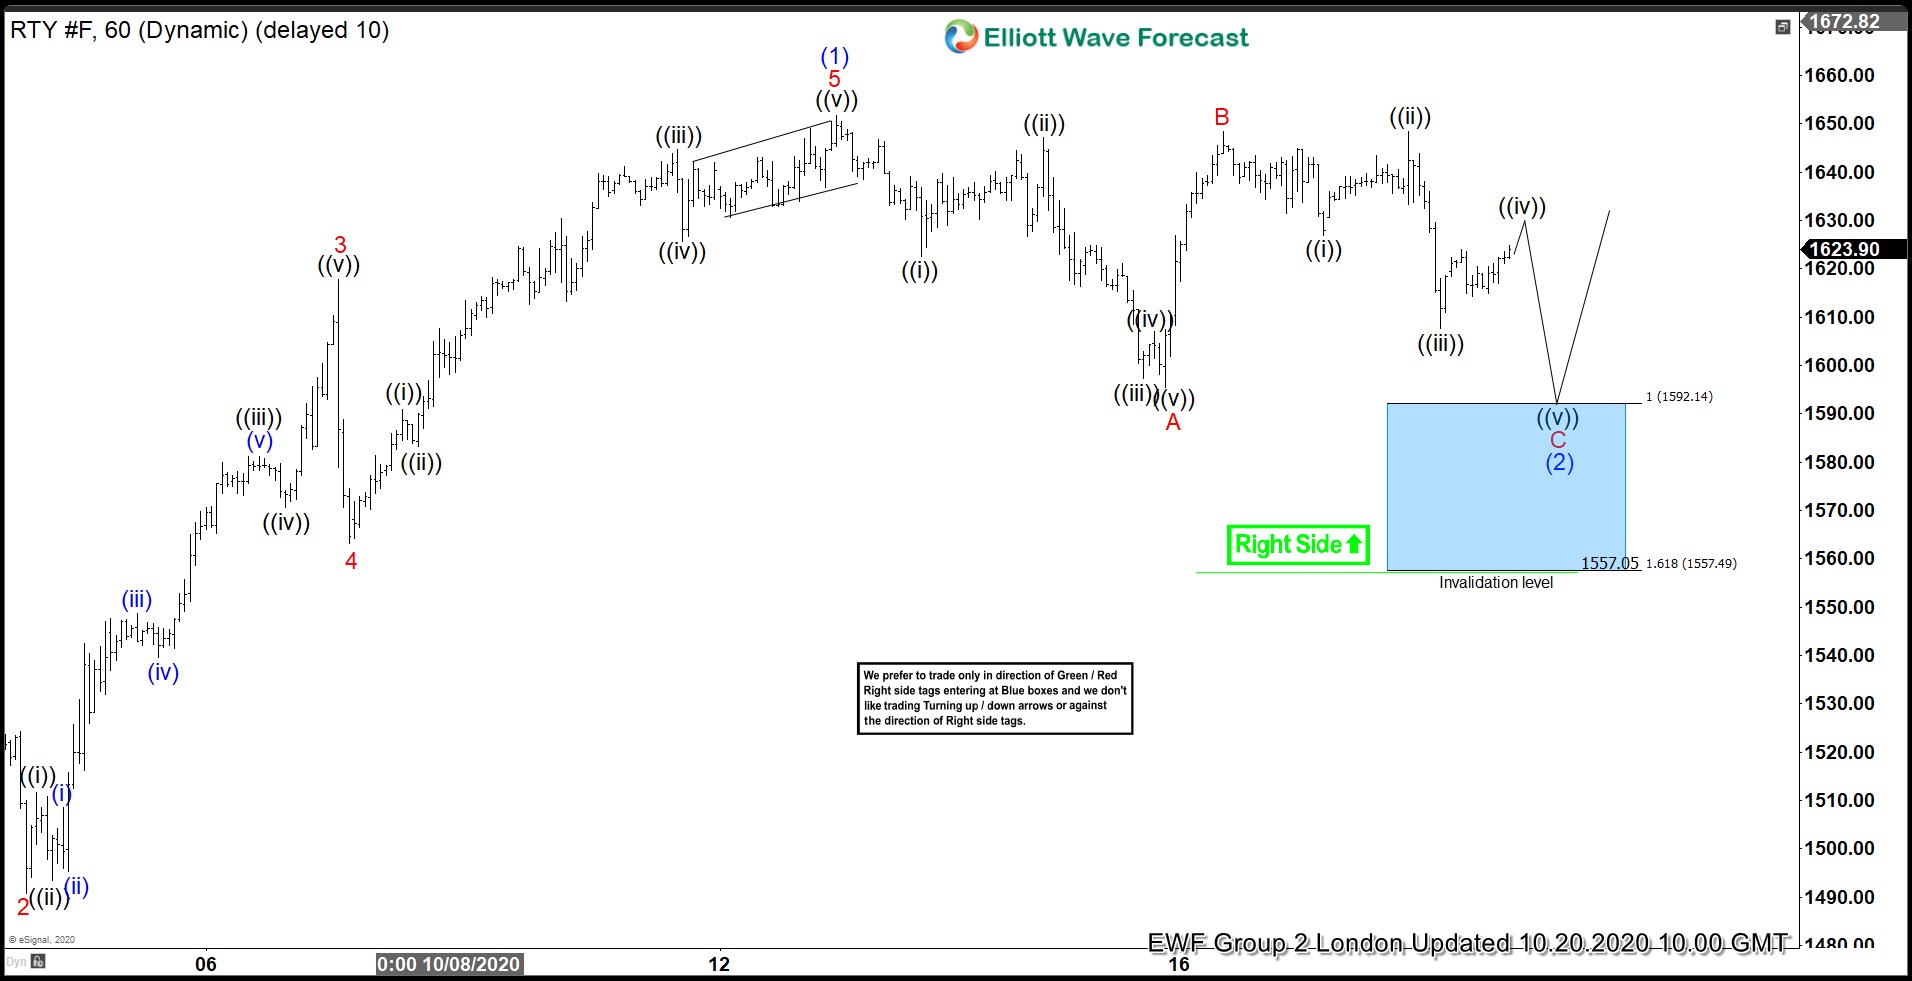
Drawing The Blue Box in the Russell
In the London updated, the Russell showed possible flat correction to complete the wave (2). That is because wave B reaction was strong near to the level of (1), classic movement for a flat structure and we looked for 3 or 5 swings down as an impulse to complete the correction. Thus, we drew the blue box in the area when the market should react to the upside. The blue box came between 1592.25 and 1557.61 levels and also we co-located the “Right Side” mark because is the main trend in the $RTY #F. We only trade in favor of the trend.
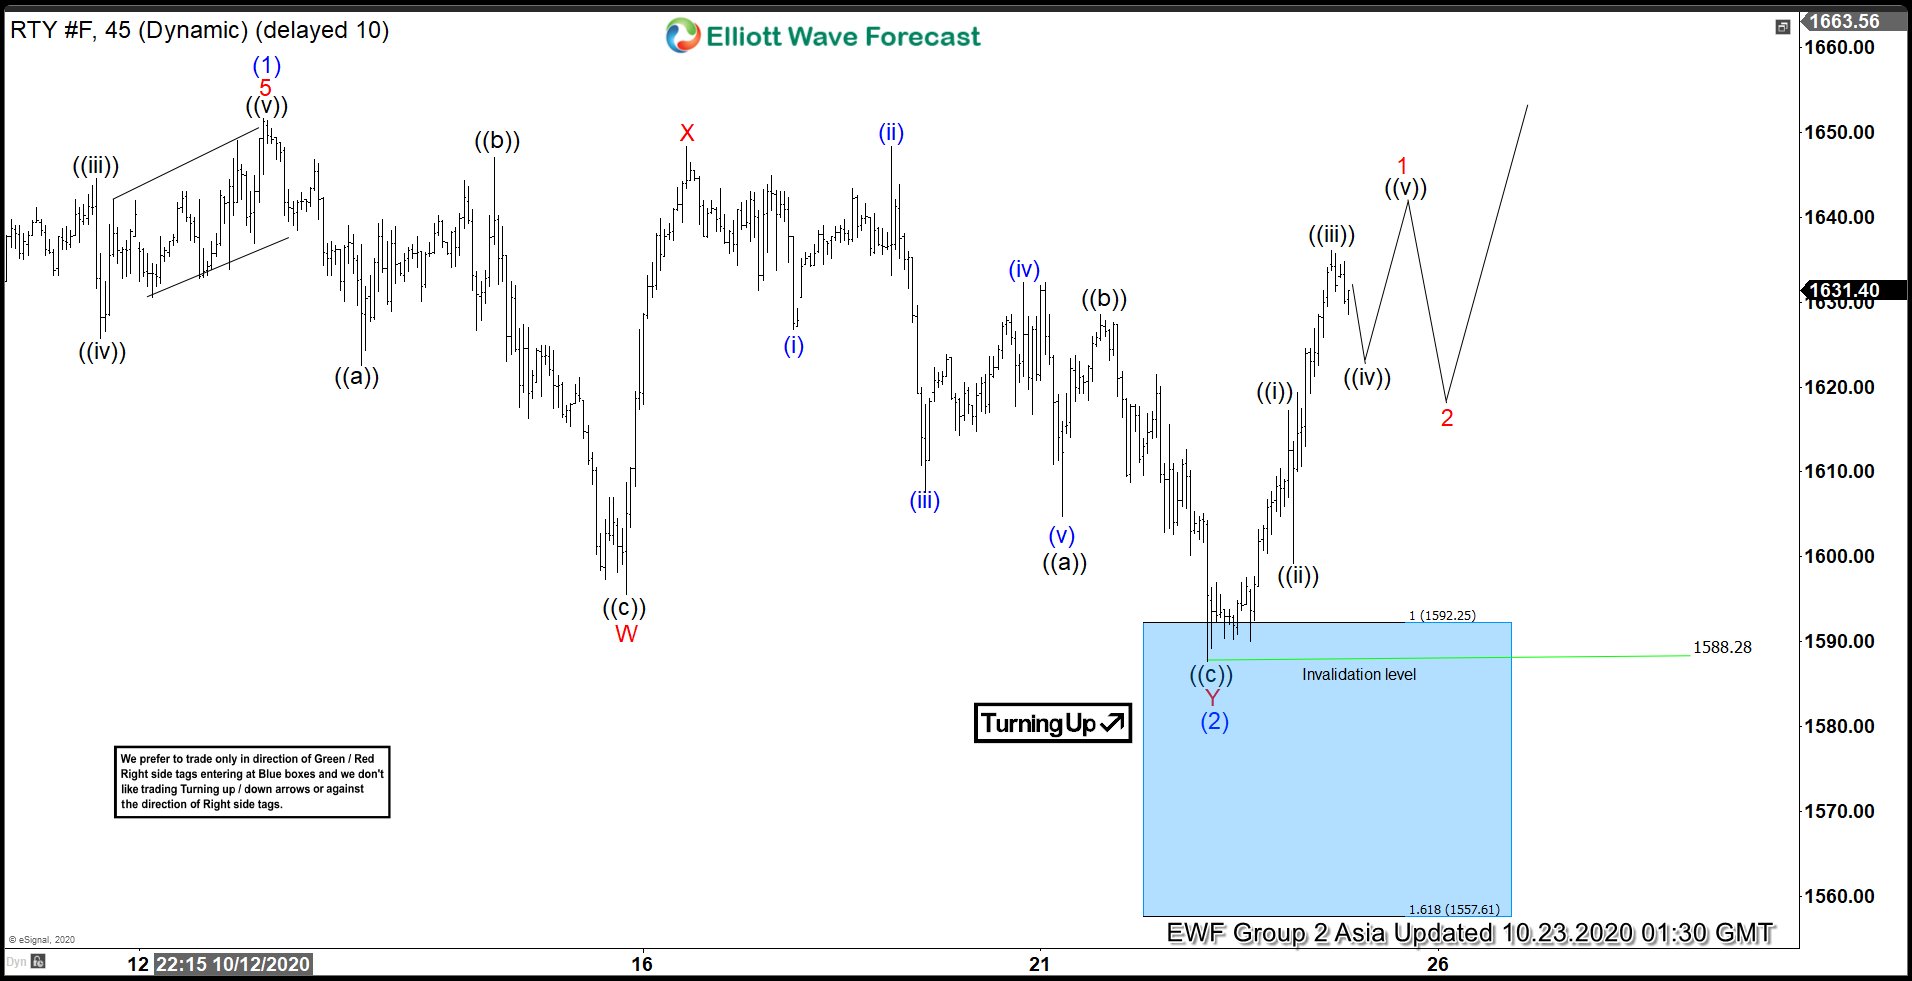
$RTY #F reaction
We readjusted the count in the next days based in how the market structure developed. The flat correction was adjusted to a WXY structure where Y was labelled as ((a)) ((b)) ((c)) zig-zag Elliott wave structure. $RTY reached the blue box at exactly 1588.28 level and since then we have seen a nice bull momentum. The bounce looks like as an impulse, but we need a little more information from the market to determine it. Break of wave (1) peak is needed to confirm that wave (2) completed, until then another push lower and a larger double correction in wave (2) still can’t be ruled out.