Hello fellow traders. In this technical blog we’re going to take a quick look at the Elliott Wave charts of Natural Gas ( $NG_F) published in members area of the Elliottwave-Forecast . As our members know, Natural Gas recently made 5 waves down from the 1.924 high. The commodity corrected the short term cycle from the mentioned peak when recovery unfolded as Elliott Wave Double Three pattern. In further text we’re going to explain the forecast and Elliott Wave Pattern.
Before we take a look at the real market example, let’s explain Elliott Wave Double Three pattern.
Elliott Wave Double Three Pattern
Double three is the most important pattern in New Elliott Wave theory and probably the most common pattern in the market these days, also known as 7 swing structure.
It’s a very reliable pattern which is giving us good trading entries with clearly defined invalidation levels and target areas.
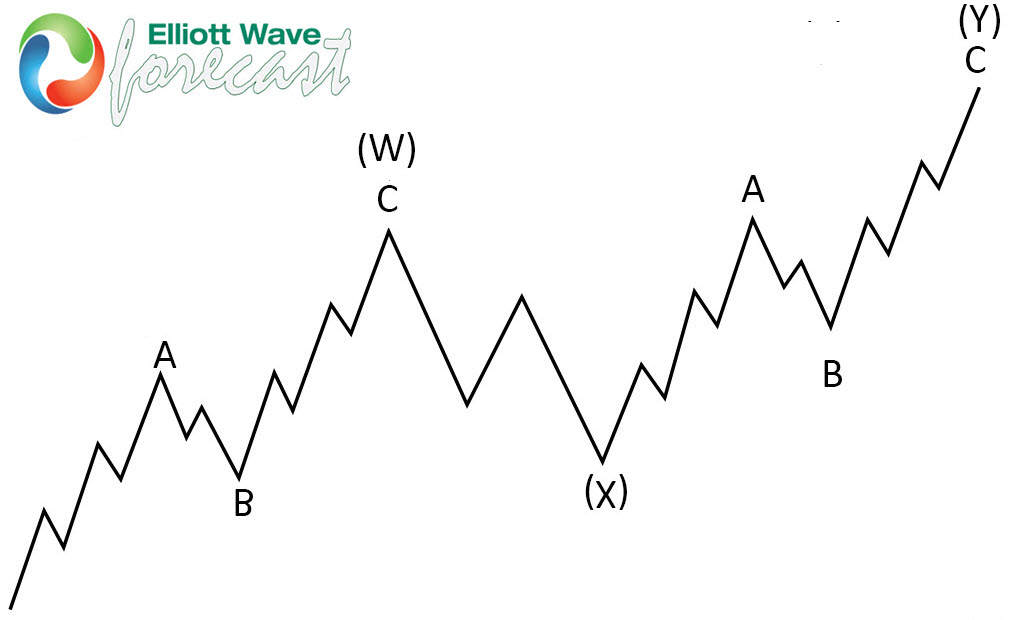
The picture below presents what Elliott Wave Double Three pattern looks like. It has (W),(X),(Y) labeling and 3,3,3 inner structure, which means all of these 3 legs are corrective sequences. Each (W) and (Y) are made of 3 swings , they’re having A,B,C structure in lower degree, or alternatively they could have W,X,Y labeling.
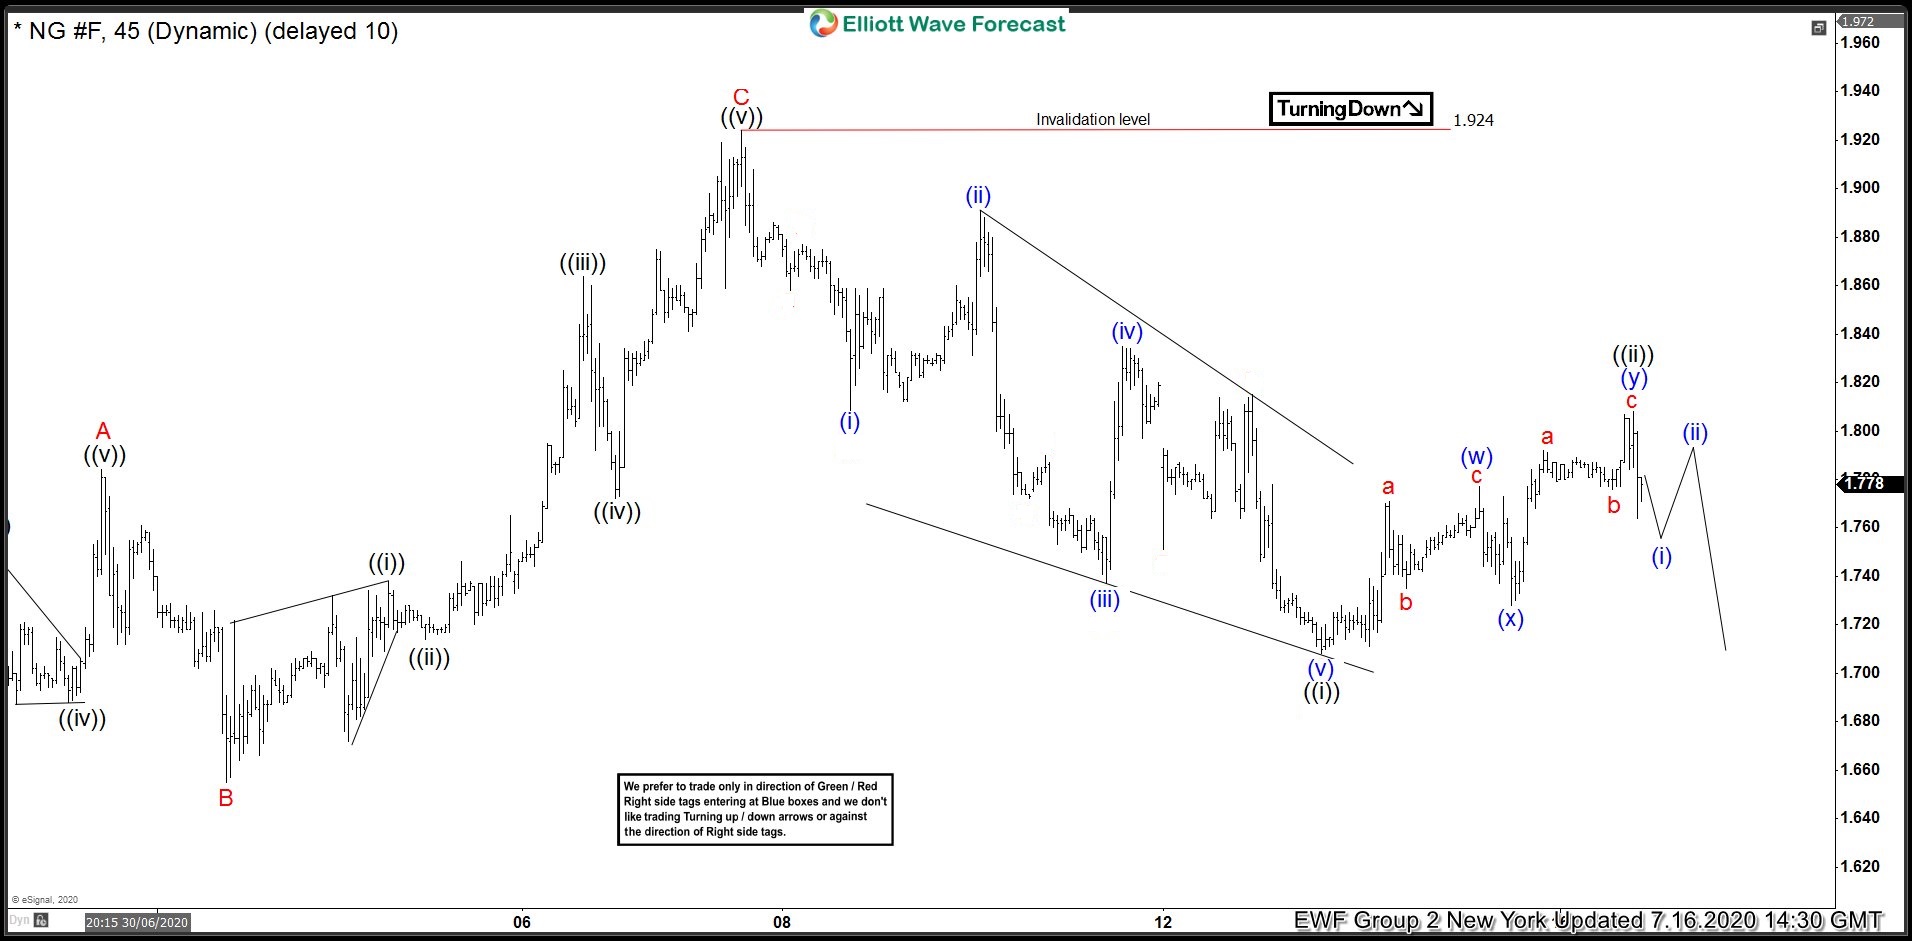
Natural Gas 1 Hour Elliott Wave Analysis 7.16.2020
Natural Gas ended short term cycle from the 1.924 peak as Leading Diagonal. Then we got recovery that unfolded as Elliott Wave double three pattern with inner labeling: (w)(x)(y) blue. Each leg of the pull back has corrective structure. At this moment we can count clear 7 swings down from the 07/14 low. Pull back is counted completed at 1.808 high. Now we would like to see further separation lower from the current high. We expect to see break of 07/14 low which will be confirmation next leg down is in progress.
You can learn more about Elliott Wave Double Three Patterns and Leading Diagonals at our Free Elliott Wave Educational Web Page.
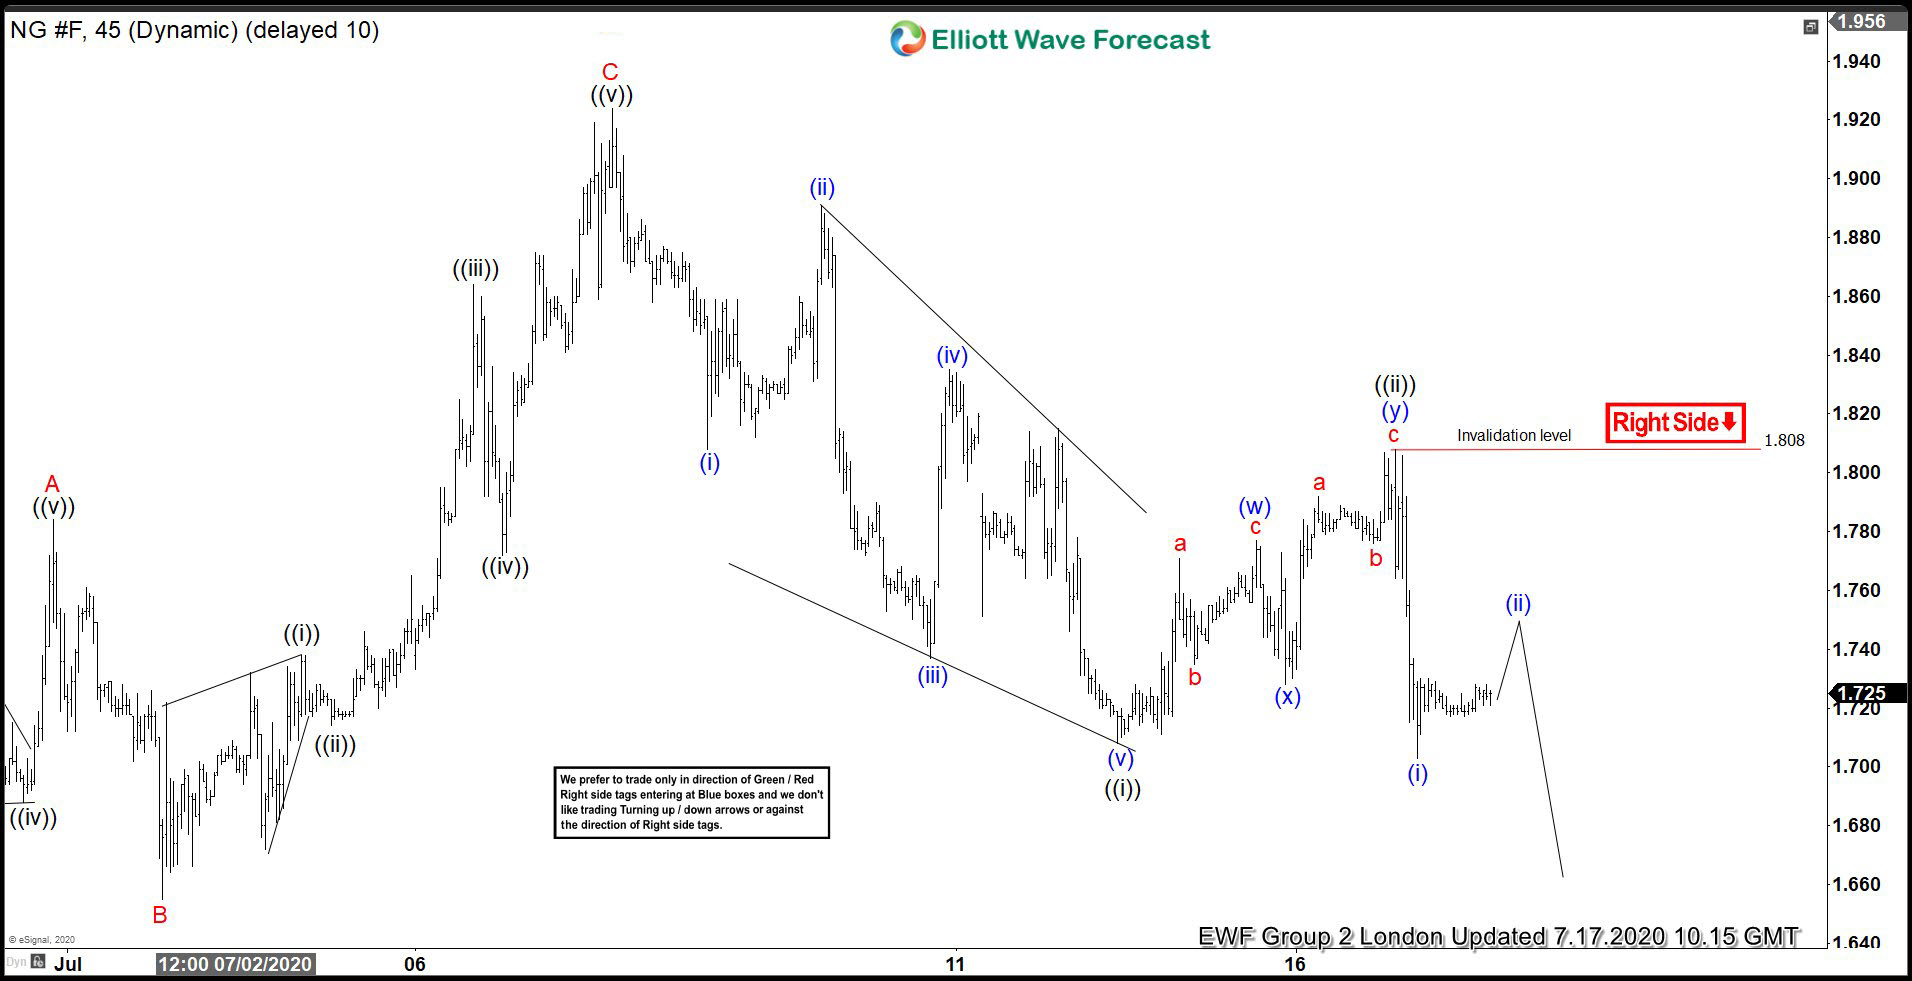
Natural Gas 1 Hour Elliott Wave Analysis 7.16.2020
1.808 peak held nicely and we got further separation from that high. Eventually Natural Gas broke 07/14 low and made incomplete sequences in the cycle from the 1.924 peak. Now Natural Gas should ideally keep trading lower as far as pivot at 1.808 high holds.
You can check most recent charts in the membership area of the site. Best instruments to trade are those having incomplete bullish or bearish swings sequences. We put them in Sequence Report and best among them are shown in the Live Trading Room.
Elliott Wave Forecast