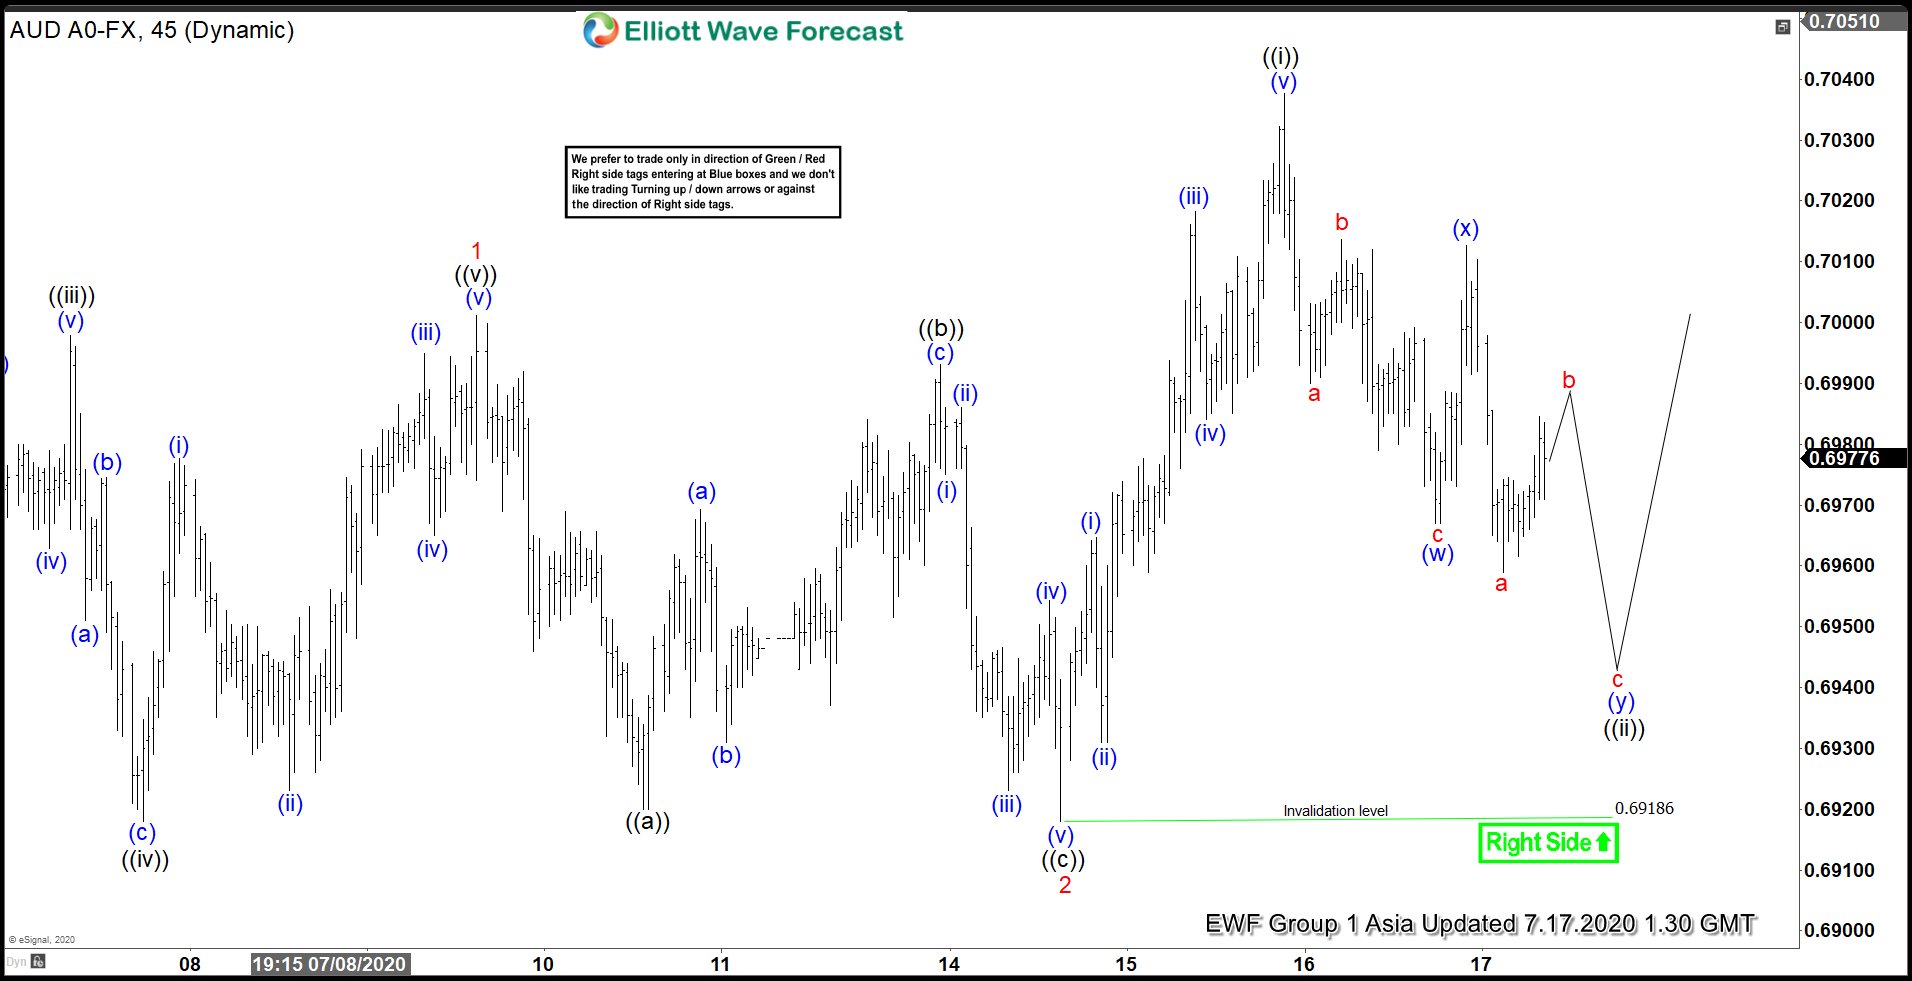
AUDUSD 45 minutes chart below shows that pair has ended cycle from July 9 high as wave 2 at 0.6918 low. The pullback unfolded as a zig-zag Elliott Wave Structure. From July 9 high, wave ((a)) ended at 0.6920 low. The bounce in wave ((b)) ended at 0.6993 high. Afterwards, the pair declined lower in wave ((c)), which ended at 0.6918 low. This ended 3 waves pullback in larger degree wave 2. From there, the pair extended higher as a 5 waves impulsive Elliott Wave Structure in wave ((i)). The rally broke above previous wave 1 high, confirming that wave 2 dip is already in place and the next leg higher is already in progress.
Up from wave 2 low, wave (i) ended at 0.6964 high. The pullback in wave (ii) ended at 0.6931 low. The pair then continued to resume higher in wave (iii), which ended at 0.7018 high. Wave (iv) pullback then ended at 0.6992 low. The pair then ended the push higher in wave (v) at 0.7037 high. Currently, a 7 swing double zigzag in wave ((ii)) is in progress. The pullback is unfolding as double three Elliott Wave Structure. Wave (w) has ended at 0.6967 low and wave (x) has ended at 0.7012 high. The pair can still extend for another low to complete wave (y). However, while above 0.6918 low, expect dips to find support in 3, 7, or 11 swings for more upside.
AUDUSD 45 Minutes Elliott Wave Chart