We at Elliottwave-Foreast.com use a lot of market correlation to derive our forecasts alongside other tools that we use. In this article, we would look at a recent example of Market correlation used in our forecasts and how a Stock Market from Asia (Hangseng) kept us on the right side in US Indices by calling more downside in them.
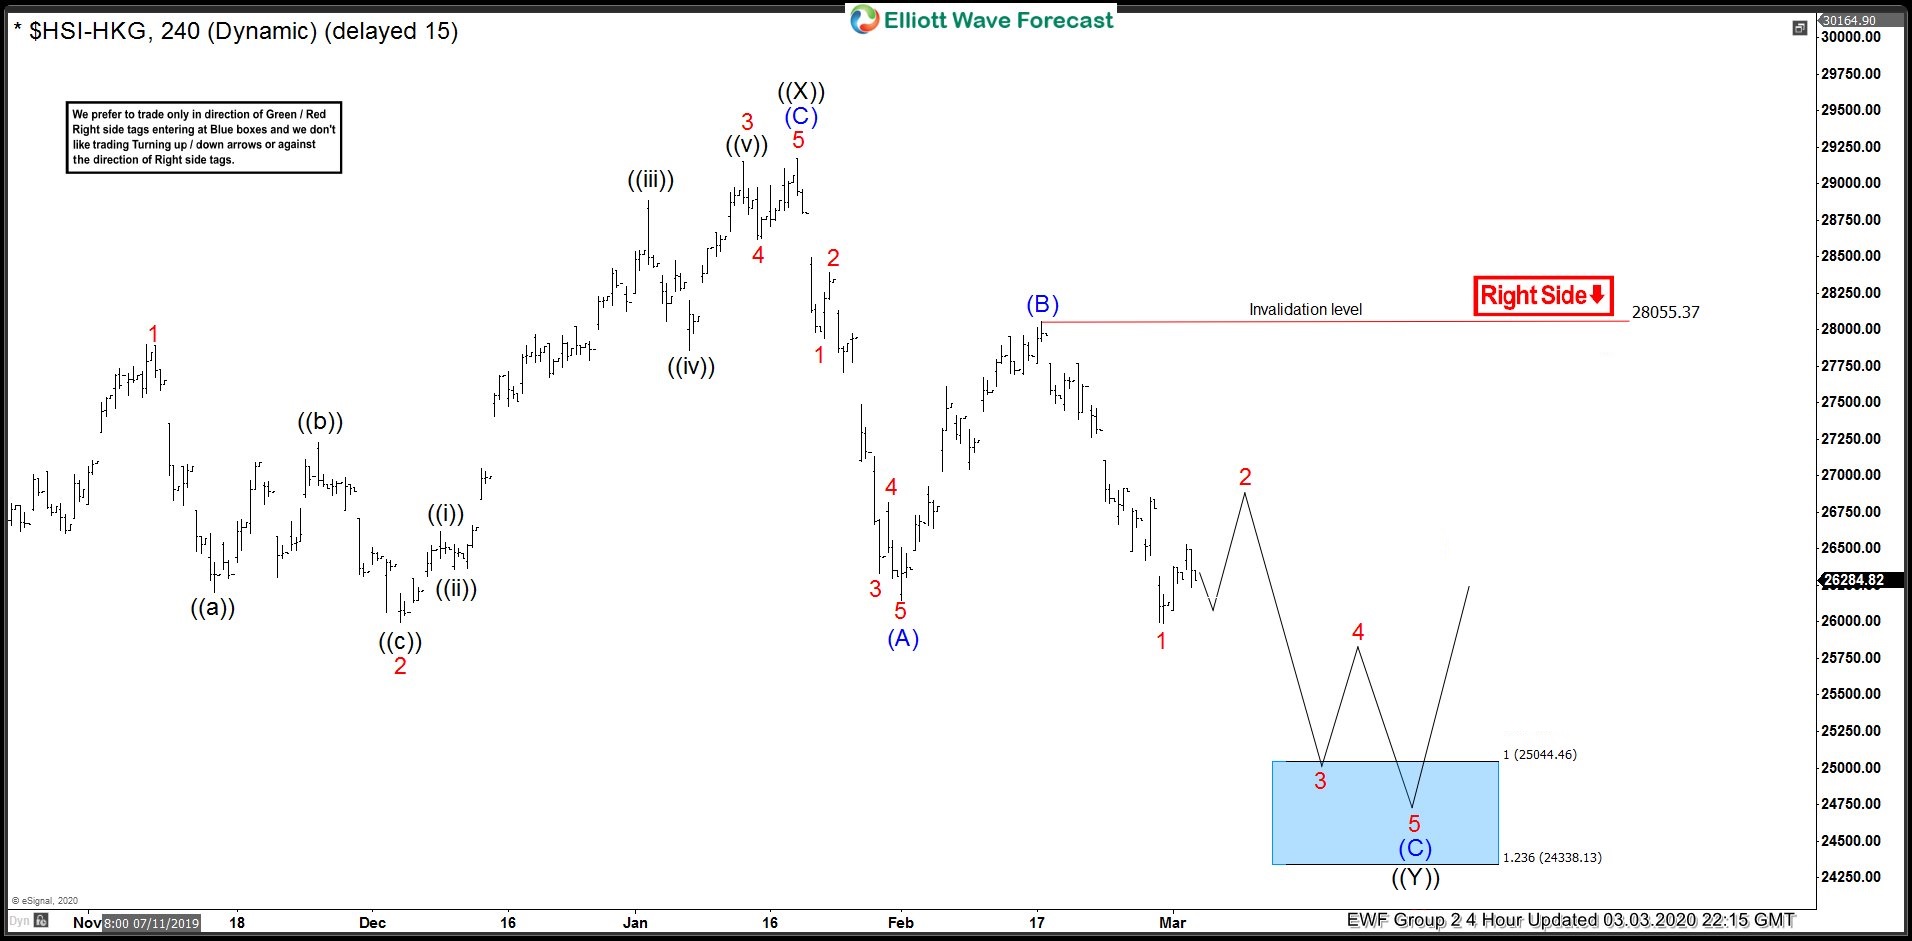
Hangseng 4 Hour Elliott Wave Analysis 3.3.2020
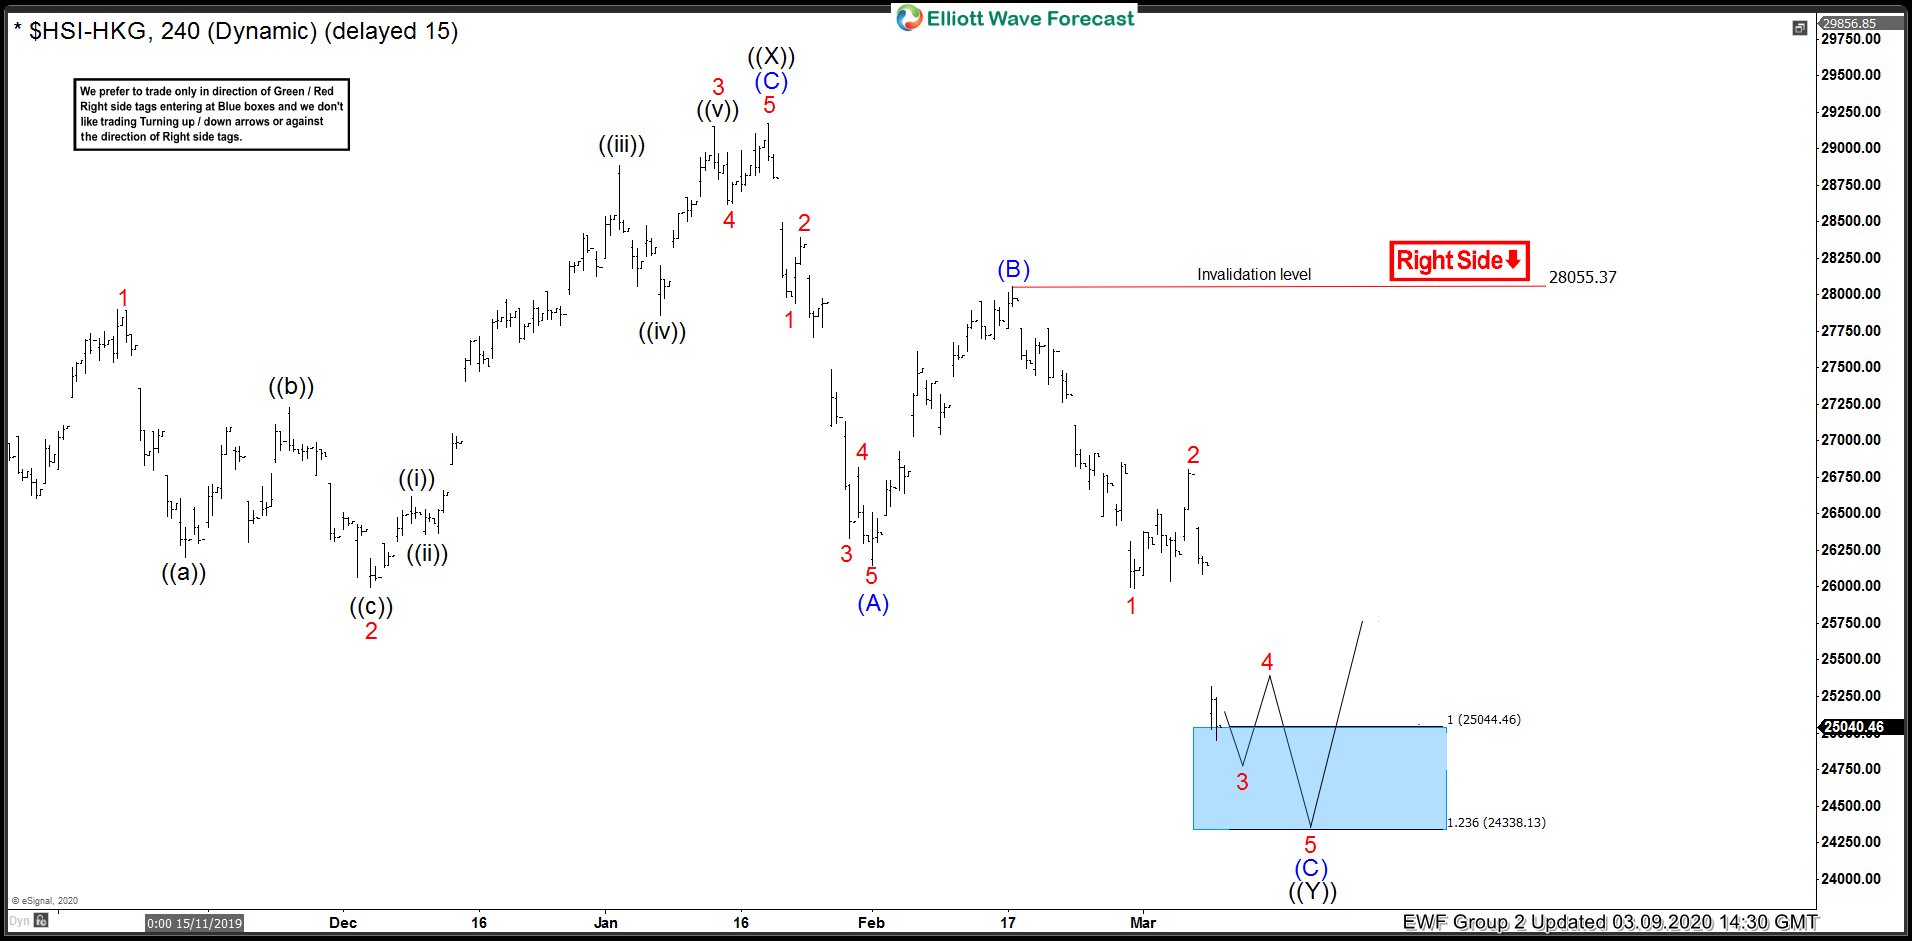
Chart below is the 4 Hour update from members area published on 3.3.2020. Chart shows a 5 waves decline down from black ((X)) to blue (A) which was followed by a corrective bounce to 28055.37 and then another low below wave (A). This break to new low below wave (A) created an incomplete bearish sequence down from black ((X)) high. The new low labelled red 1 also had momentum divergence (not shown on the chart) which confirmed the view that the sequence was incomplete and a bounce in wave 2 should fail for more downside with minimum target in the range of 25044.46 – 24338.13 which is the 100 – 123.6% Fibonacci extension area of the decline from black ((X)) high to wave (A) low projected lower from wave (B) high.
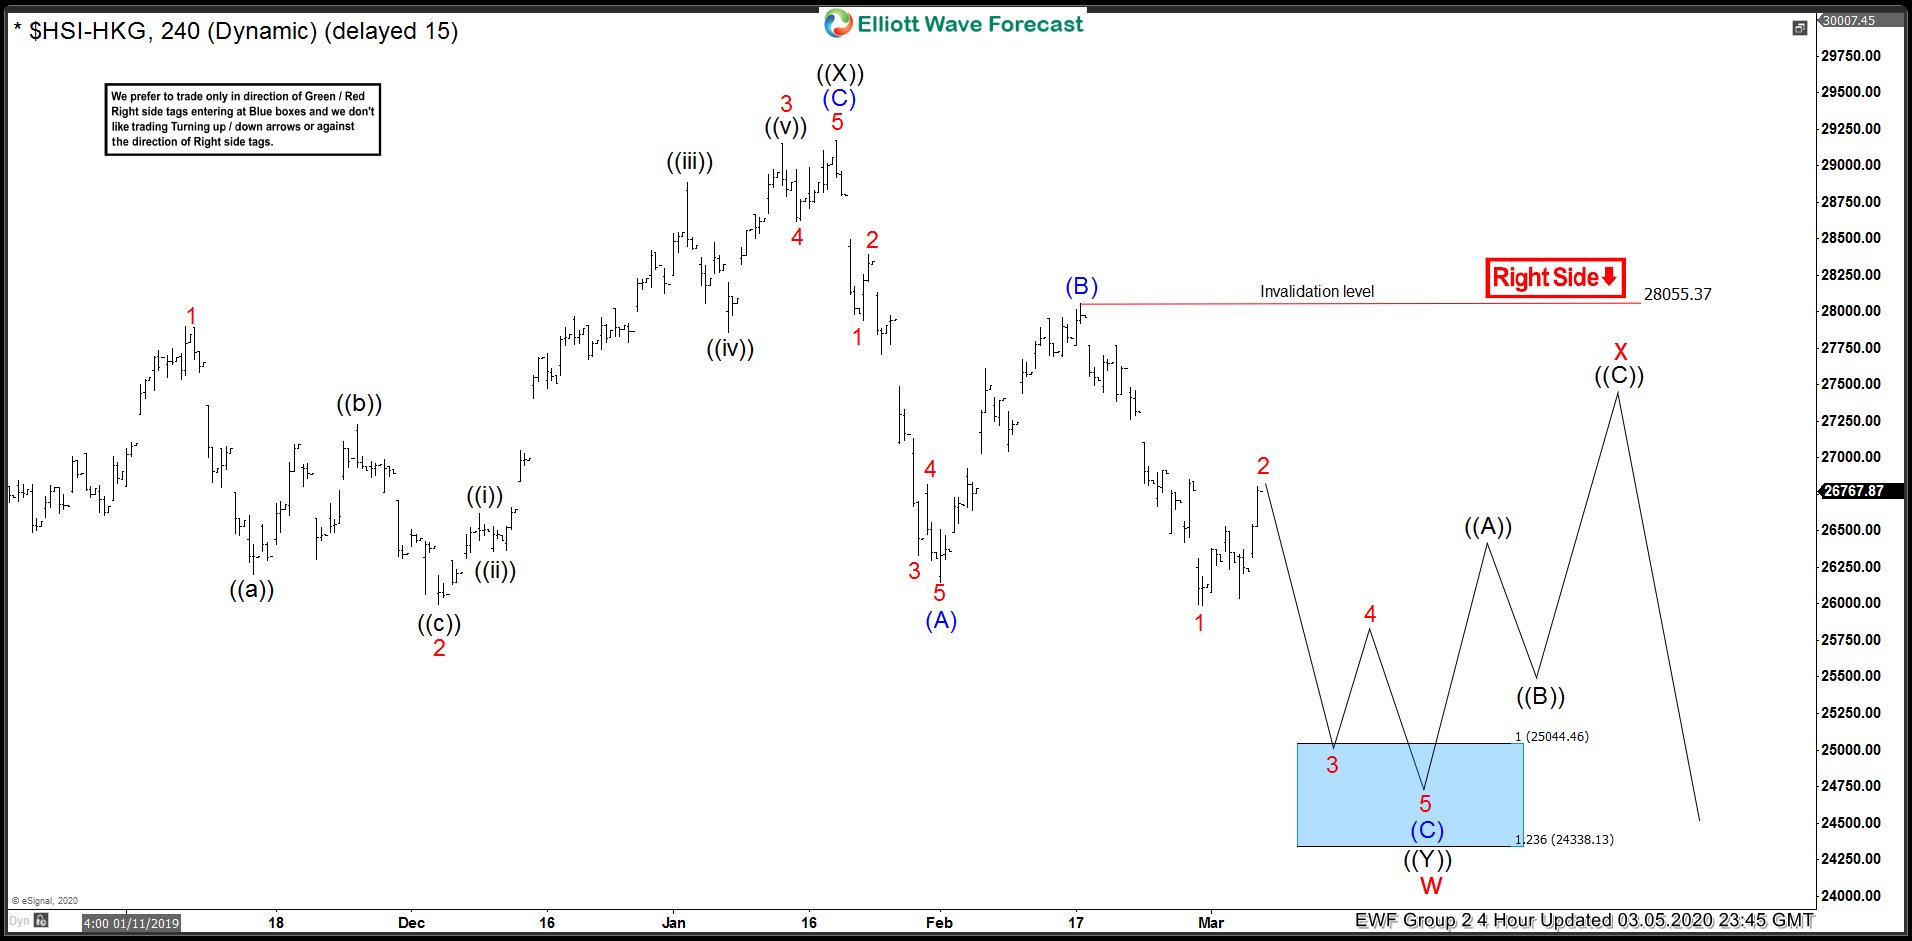
Hangseng 4 Hour Elliott Wave Analysis 3.5.2020
Chart below shows we had a bounce in wave 2 as expected and the market was in the areas from where it could start the next leg lower toward 25044.46 – 24338.13 area. Also, the 1 hour chart shown below showed the blue box area where we expected 3 waves within wave 2 to end and Hangseng Index to resume the decline wave 3 of (C) or pull back in 3 waves at least.
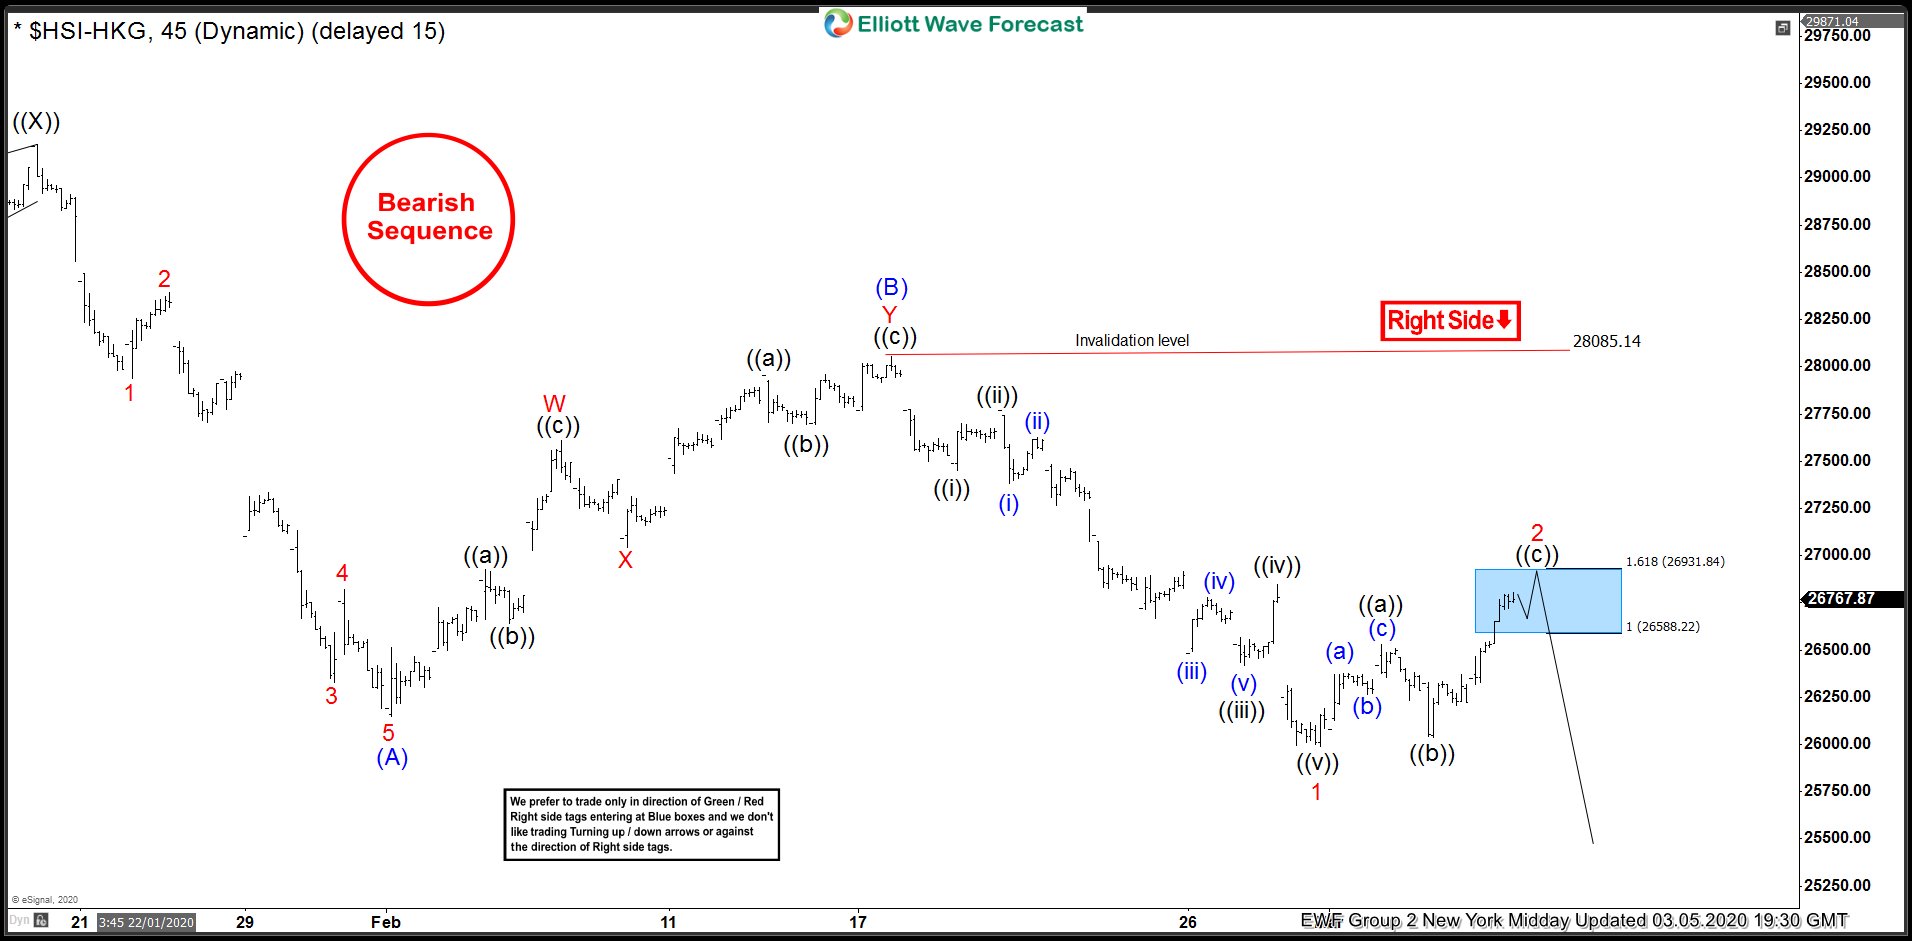
Hangseng 1 Hour Elliott Wave Analysis 3.5.2020
Hangseng 4 Hour Elliott Wave Analysis 3.9.2020
Hangseng sold off this week and reached the blue box target area between 25044.46 – 24338.13. Decline from wave (B) high is still in 3 waves so ideally we would be looking for a bounce in wave 4 and another high to complete the cycle from ((X)) peak but as it already reached the shorts target, chasing downside at this stage in Hangseng is a risk proposition.
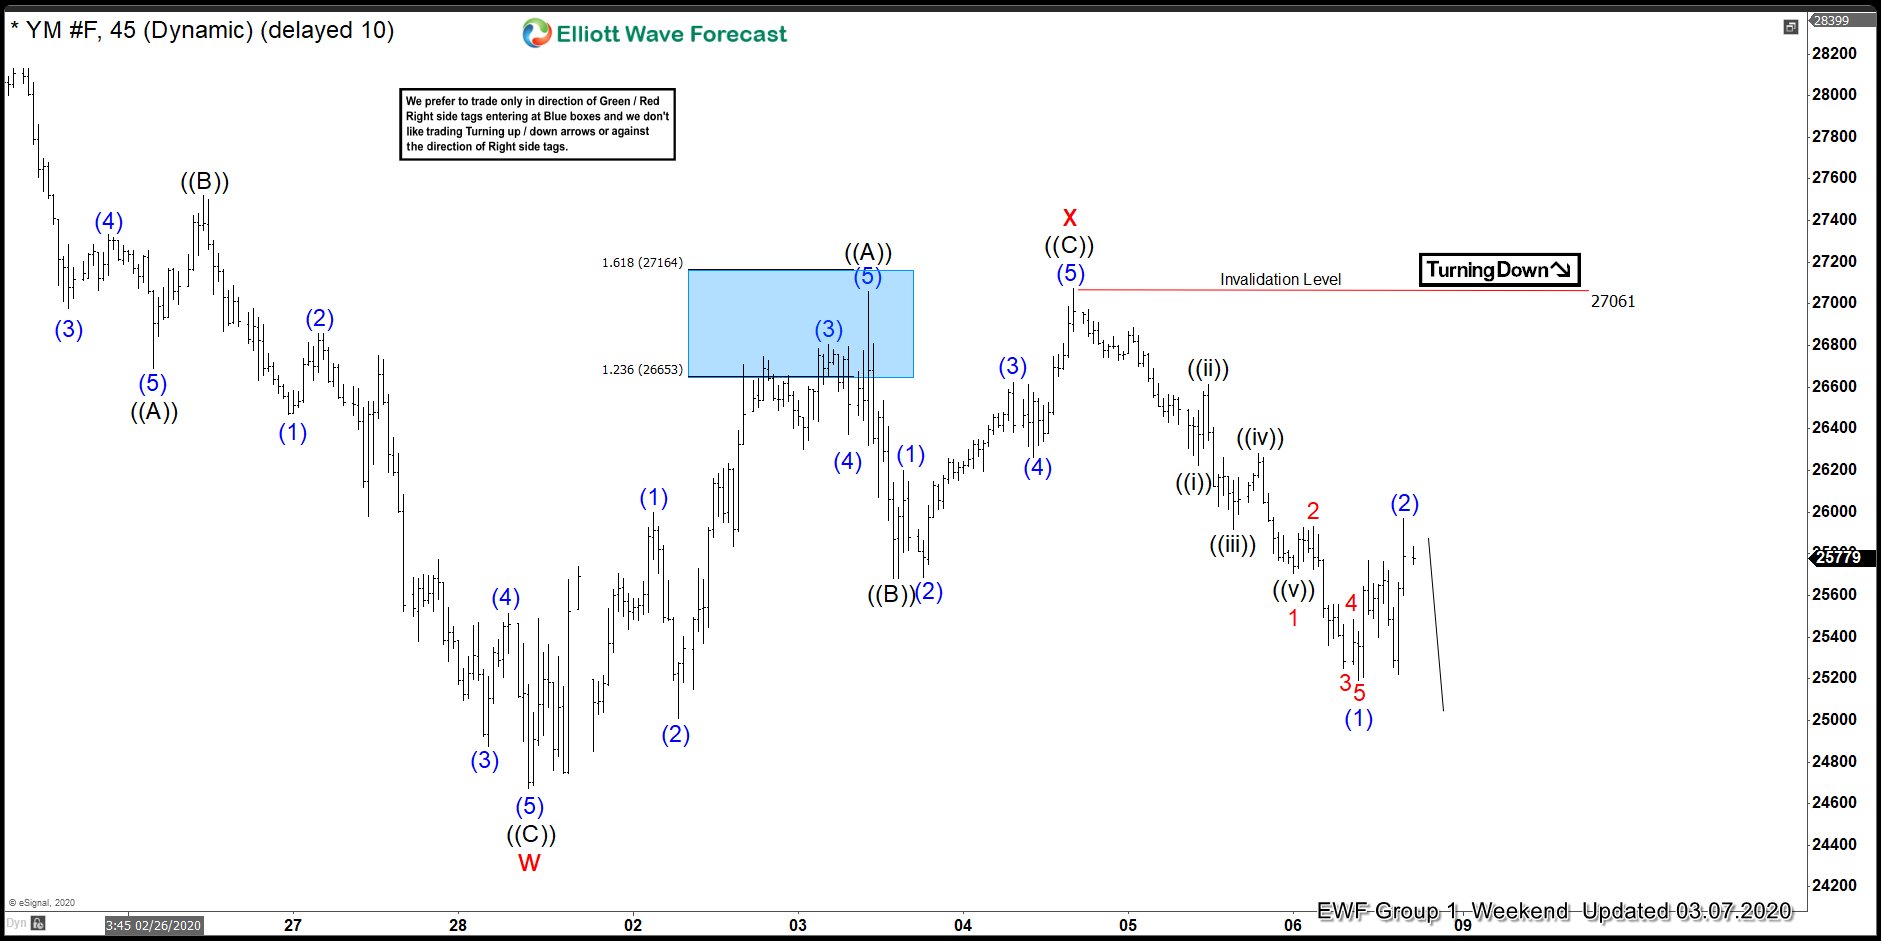
Since we had an incomplete bearish sequence in Hangseng Index and it had already seen a 3 waves bounce from the low, we called US Indices also to see more downside because the high in US Indices was seen on 2.20.2020 where as (B) wave high in Hangseng was seen on 2.17.2020 so if Hangseng extended lower against the 2.17.2020 peak, it only made sense for US Indices to extend lower against 2.20.2020 high and see more downside. Below is the 1 hour chart of Dow Futures presented to our clients in the weekend update on March 7, 2020.
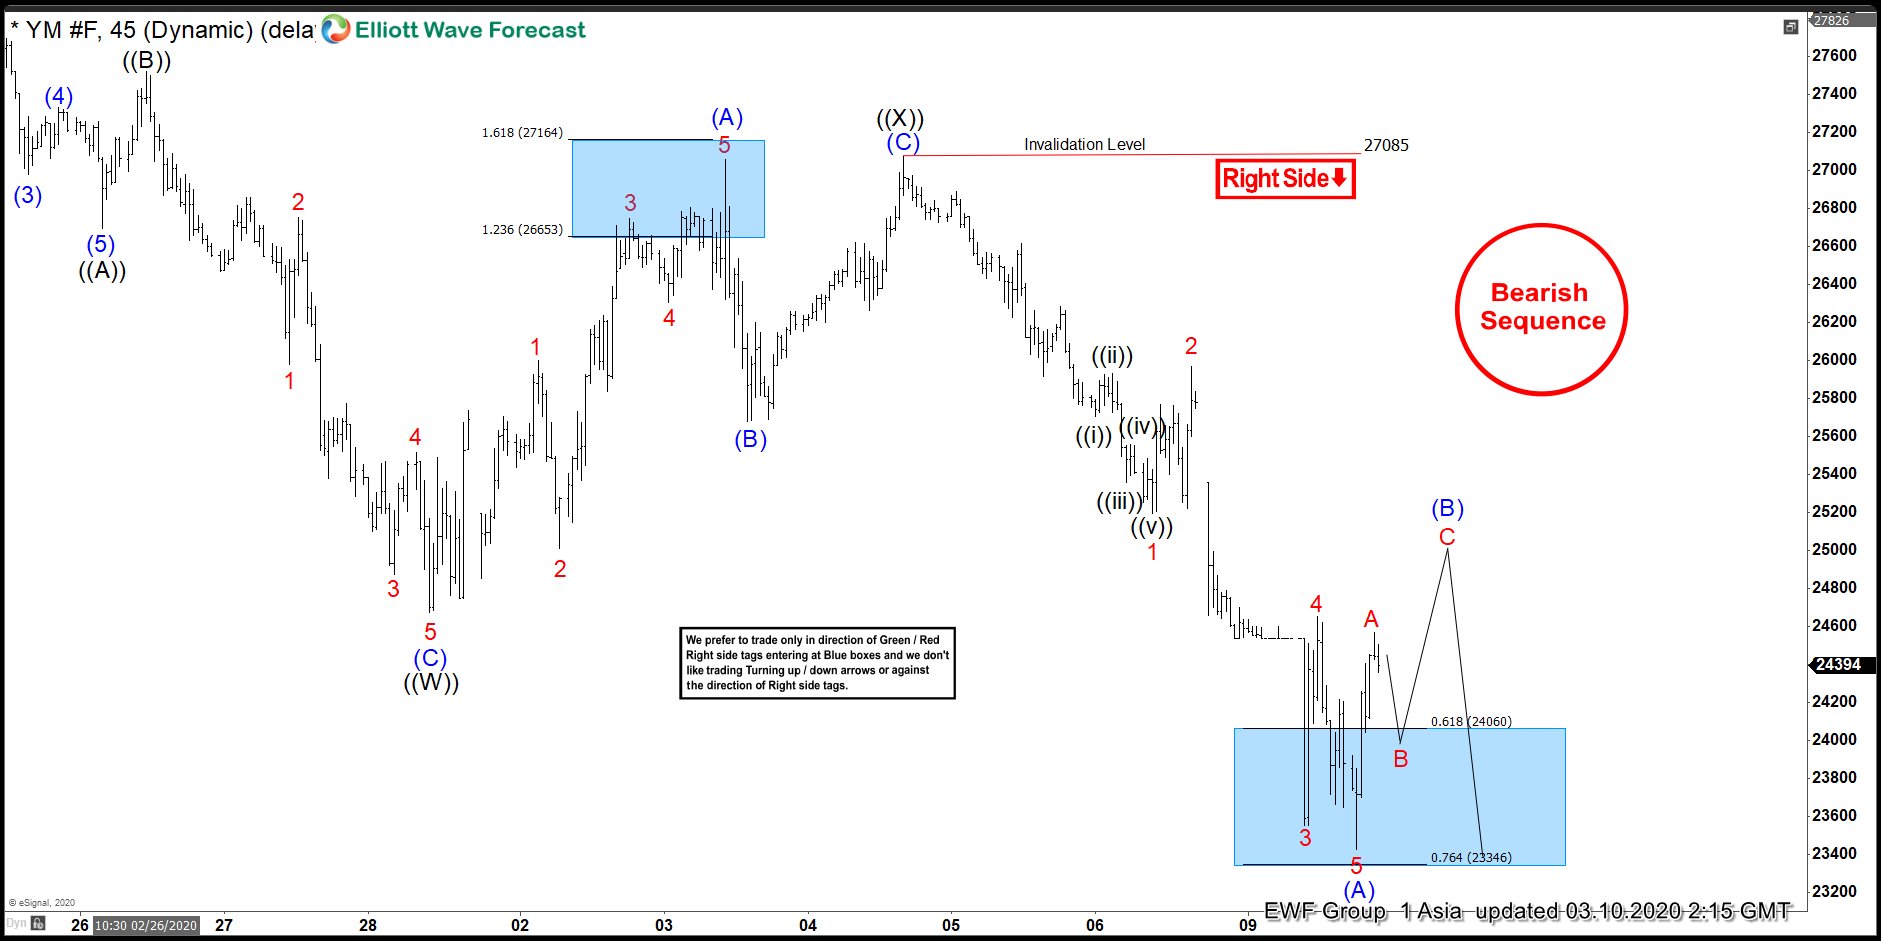
YM_F 1 Hour Elliott Wave Analysis 3.7.2020
$YM_F 1 Hour Elliott Wave Analysis 3.10.2020
$YM_F resumed the decline and dropped to new lows as expected. It reached the blue box area and a bounce in 3 waves at least is expected to take place as the chart below indicates. This is how we were able to use the market correlation and call drop to new lows below 2.28.2020 low in US Indices based on an Asian stock market showing an incomplete sequence. This is why we are always referring to the concept of one market.