Bank of America (Ticker: BAC) decline from December 27, 2019 high is unfolding as a 5 waves impulsive Elliott Wave structure. Down from December 27 high, wave ((1)) ended at $32.47 and wave ((2)) ended at $35.45. The stock has resumed lower in wave ((3)) and internal of wave ((3)) subdivides in an impulse in lesser degree. Down from $35.45, wave (1) ended at $27.44 and bounce in wave (2) ended at $29.8.
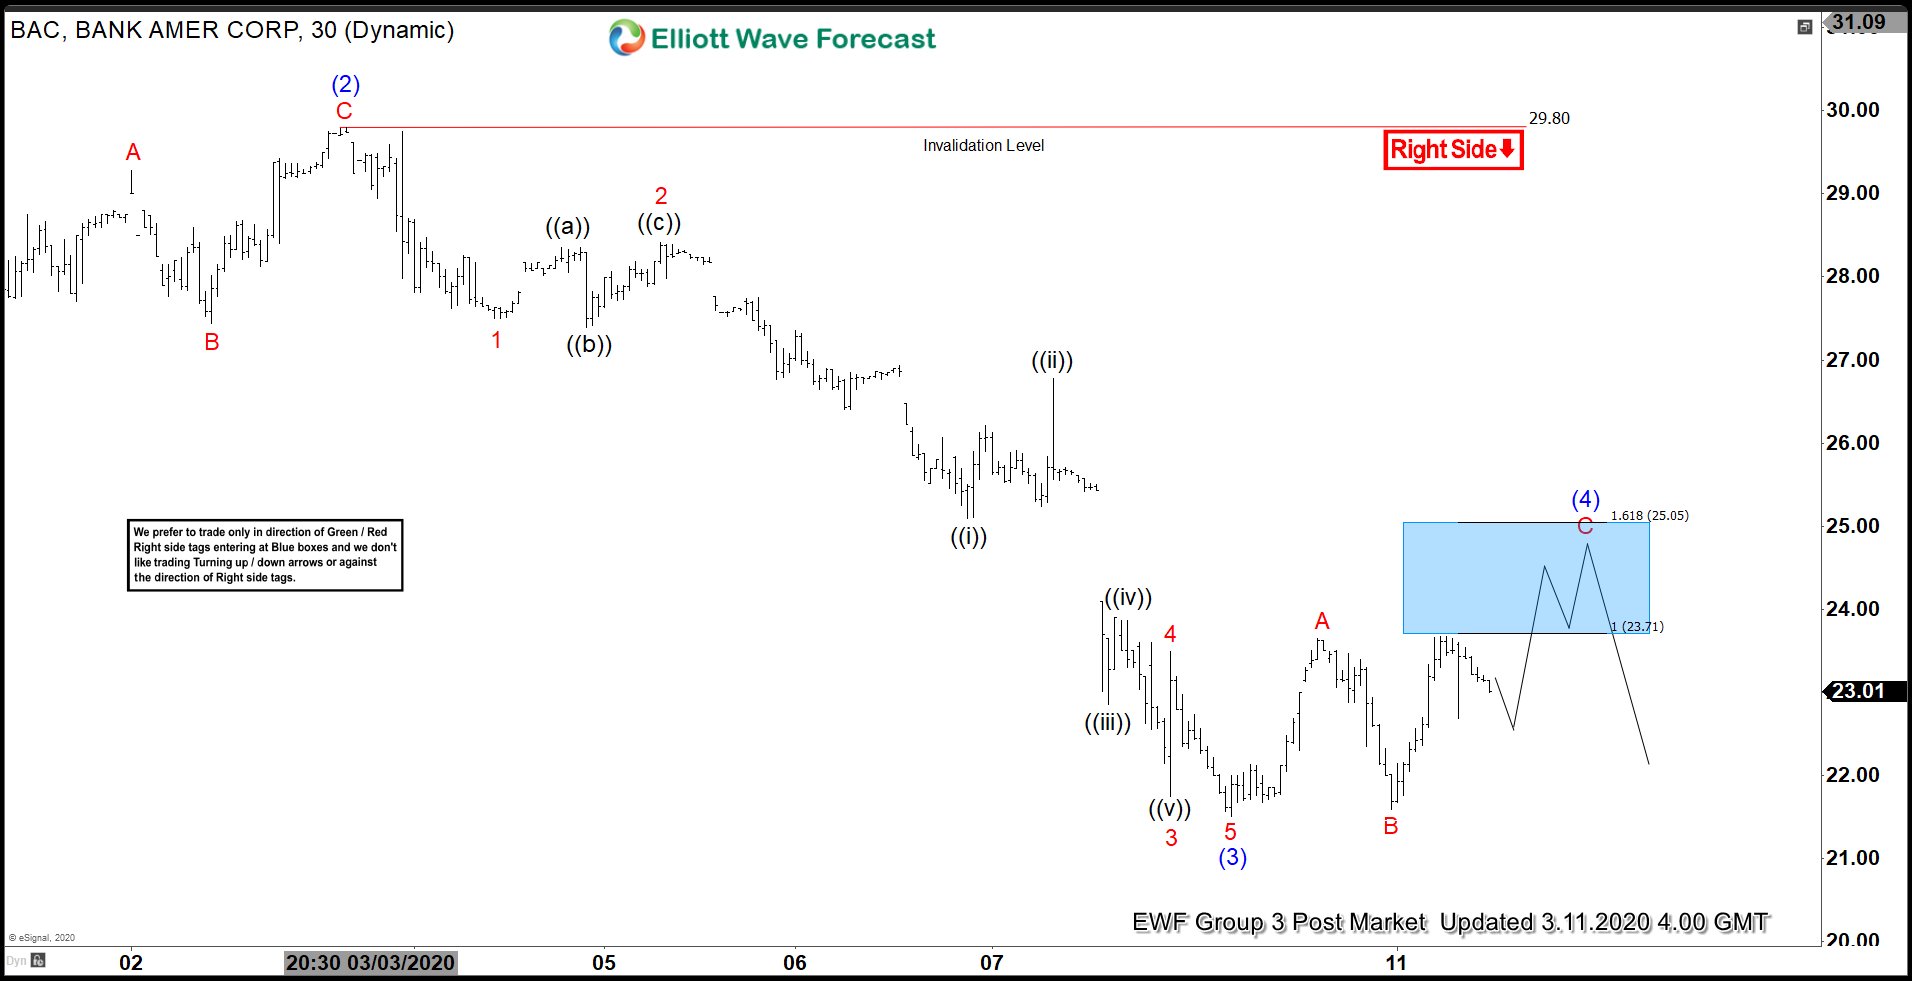
In the chart below, we can see that down from $29.8, wave 1 ended at $27.50 and bounce in wave 2 ended at $28.42 as a Flat. Stock then resumed lower in wave 3 towards $21.75 and bounce in wave 4 ended at $23.49. Finally wave 5 ended at $21.51 which also completed wave (3). Wave (4) rally is now in progress to correct cycle from March 3 high. Potential target for wave (4) in 3 swing comes at $23.7 -$25. Sellers can appear from this area for more downside or 3 waves pullback at least. We don’t like buying the stock. Expect rally in Bank of America to fail in the sequence of 3, 7, or 11 swing as far as pivot at 29.80 high stays intact
Bank of America (BAC) 1 Hour Elliott Wave Chart