
Hello fellow traders. I want to share with you some Elliott Wave charts of EURGBP which we presented to our members at Elliott Wave Forecast. You see the 4-hour updated chart presented to our clients on the 01/26/19 below
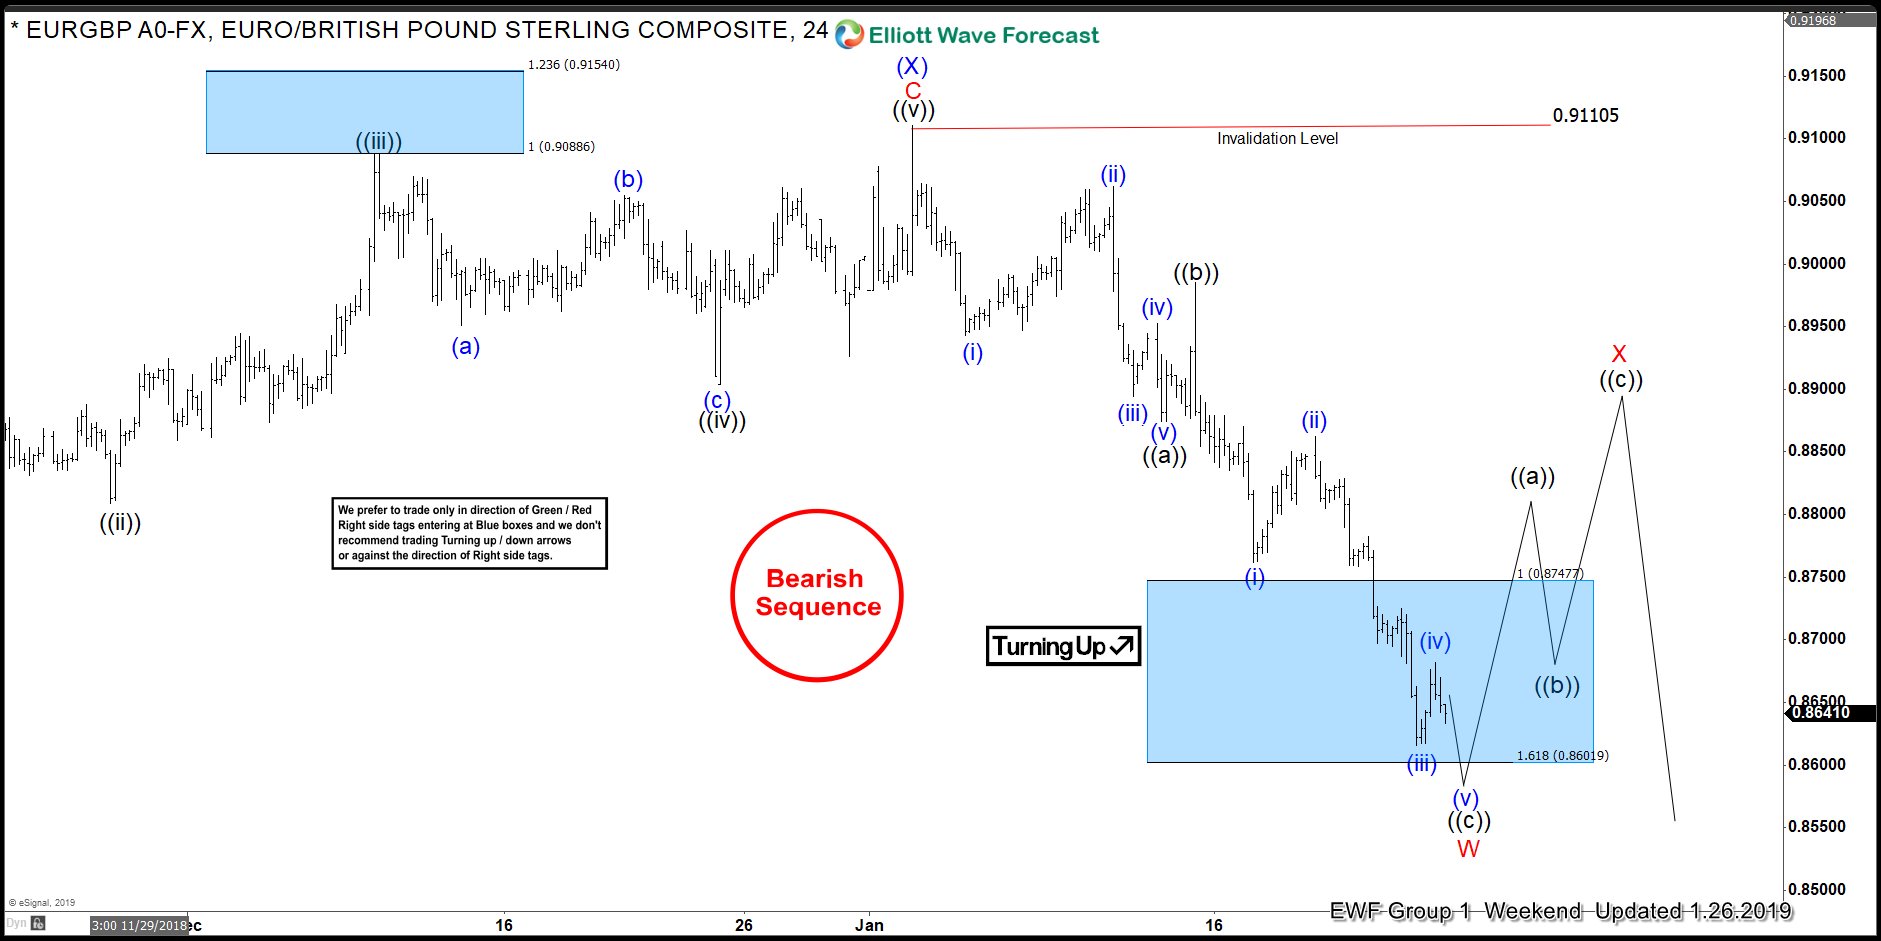
EURGBP unfolded as an Elliott Wave Zig-Zag structure from 01/02/19 peak. Decline from there ended black wave ((a)) at 0.88768 and wave ((b)) bounce ended at 0.89840. Black wave ((c)) of red wave W should end soon as it has reached our blue box area. This area comes at 0.87477-0.86019, which is 100% – 161.8% Fibonacci extension from black ((a))-((b)). Pair should rally in the sequences of 3-7 or 11 swings to correct the cycle from 01/02/19 peak.
EURGBP 01.26.2019 4 Hour Chart Elliott Wave Analysis
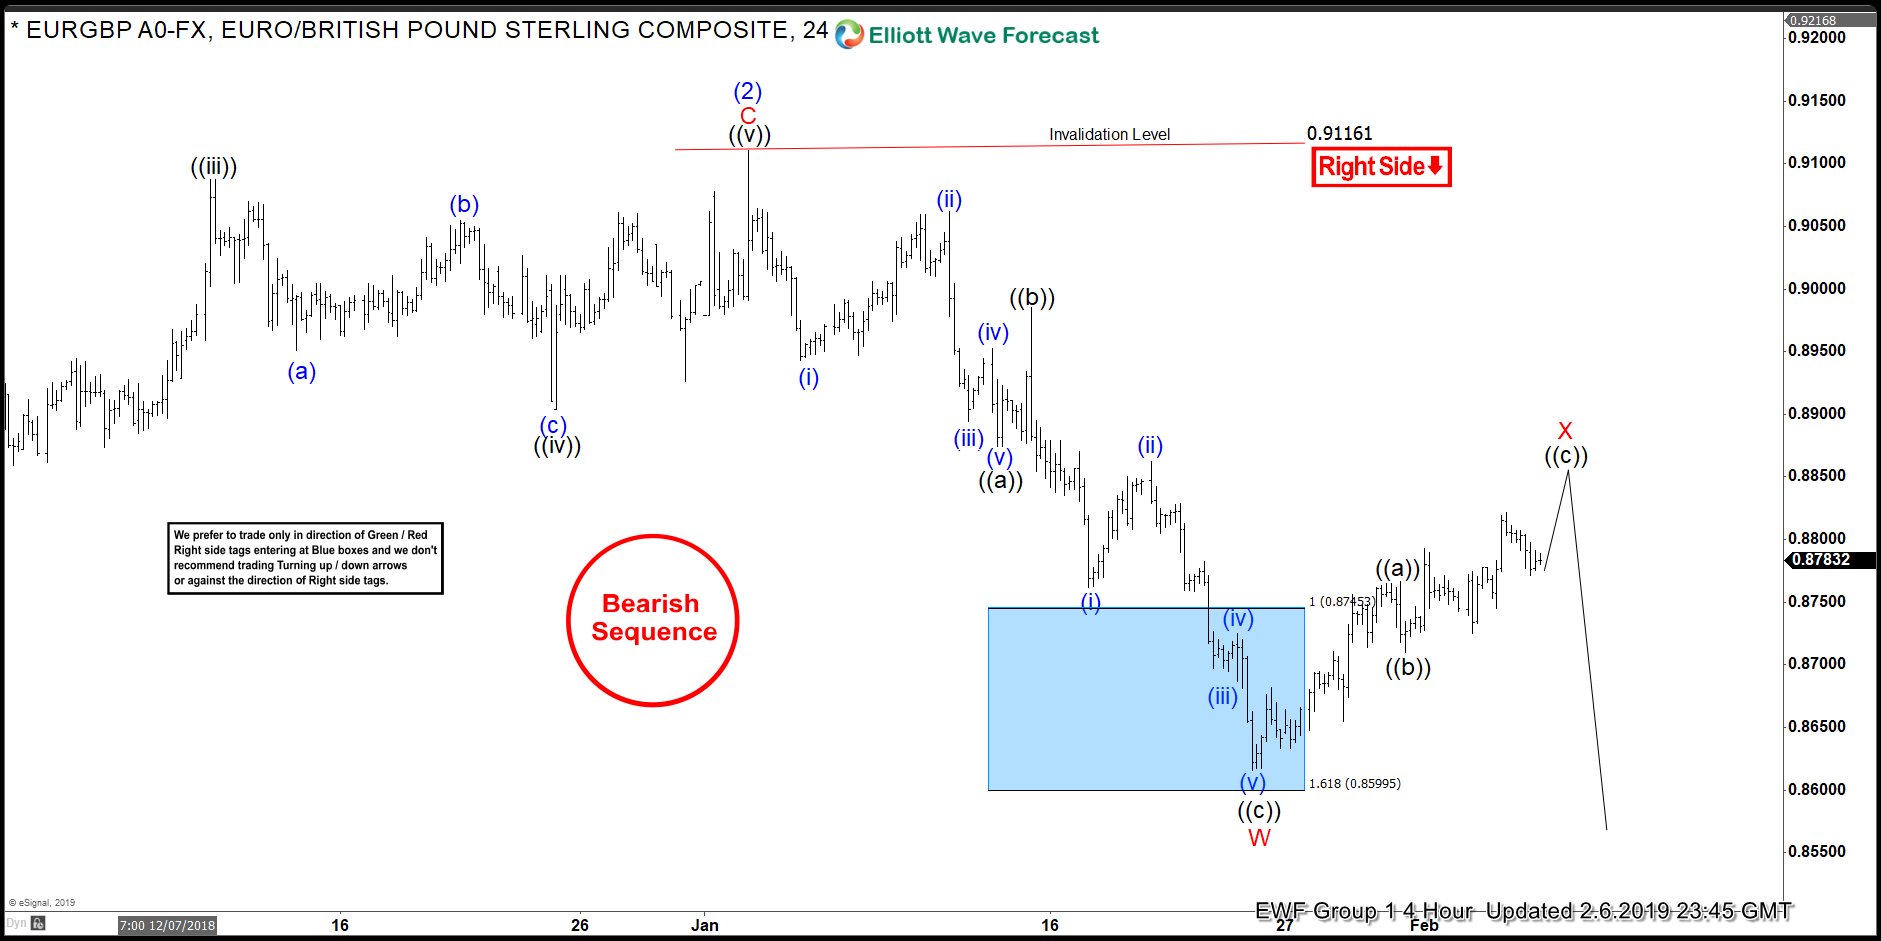
In the Elliott Wave chart update below, you can see that black wave ((c)) of red wave W ended at around 0.86153 low. Above from there, it started the expected bounce in red wave X. Due to the right side tag against 0.91161 peak and the bearish sequence tag, we advised members that selling EURGBP in the sequences of 3-7 or 11 swings will be the idea to go. Please keep in mind that the 4-hour charts which I presented can have changed already. The purpose of this blog is just to illustrate how accurate our blue boxes are. Our members can use the blue box and right side stamp and buy/sell correction in 3-7 or 11 swings.
EURGBP 02.06.2019 4 Hour Chart Elliott Wave Analysis
I hope you like this blog and I wish you all the best.