
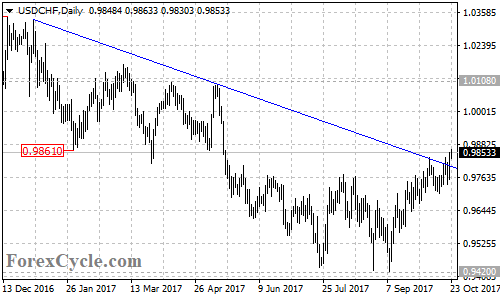
USDCHF extended its upside movement from 0.9420 to as high as 0.9863, breaking above a major bearish trend line on the daily chart, confirming that the downtrend from 1.0343 had completed at 0.9420 already.
On the upside
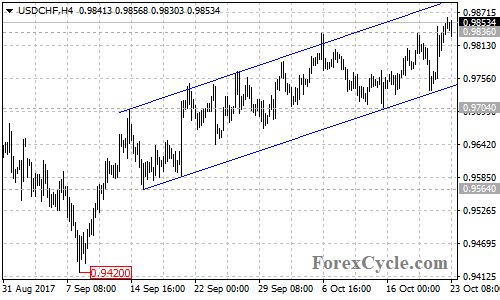
Let’s look into the 4-hour chart, the USDCHF pair moved within a rising price channel and broke above 0.9836 resistance. As long as the price is in the channel, the upside movement from 0.9420 could be expected to continue, and next target would be at the 61.8% Fibonacci retracement taken from 1.0343 to 0.9420 at 0.9990, followed by the April 10 high of 1.0108.
On the downside
Near term support is at the bottom trend line of the price channel now at around 0.9745. A clear break below the channel support could bring price back to next support level at 0.9704. Below this level will indicate that the upside move from 0.9420 is complete, then the following correction pullback could take price to another support level at 0.9564.
For long term analysis
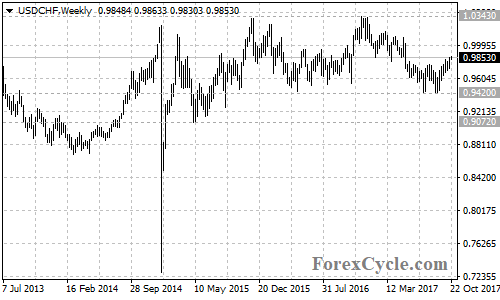
The USDCHF pair is forming a sideways consolidation in a trading range between 0.9420 and 1.0343 on its weekly chart. Another rise towards towards 1.0343 resistance would likely be seen over the next several weeks. At the same time, the 0.9420 level could be treated as a neckline of a double top pattern on the weekly chart, below this level will indicate that a reversal pattern had been formed, this could trigger a 900 pips drop towards 0.8500.
Technical levels
Support levels: 0.9745 (the bottom of the price channel on the 4-hour chart), 0.9704 (the October 13 low), 0.9564 (the September 15 low), 0.9420 (the neckline of the double top pattern on the weekly chart), 0.9072 (the May 2015 low), 0.8500 (the measured move target of the double top pattern).
Resistance levels: 0.9990 (the 61.8% Fibonacci retracement), 1.0108 (the April 10 high), 1.0343 (the December 15, 2016 high).