
After hitting a highest record at 2889, BTCUSD fell sharply to 2251, and is now forming a triangle pattern on its 4-hour chart. All we need to do now is wait for a break out of the pattern.
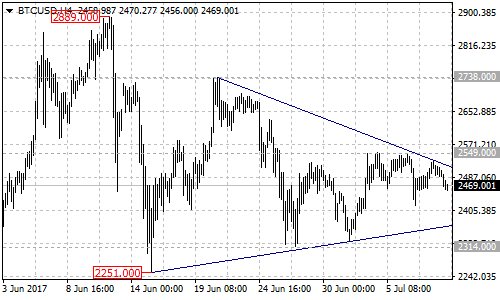
Near term resistance is at the top trend line of the triangle pattern at around 2515, followed by 2549. Above these levels could take price to test the key resistance at 2738. Near term support is at the bottom trend line of the triangle patter at around 2365, followed by 2314. Below these levels could trigger another sharp drop to around 2000.
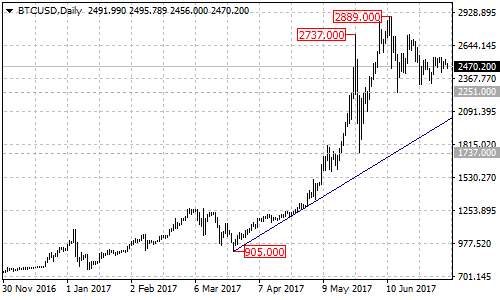
For long term analysis, there is a bullish trend line started from the March 25 low of 905 with support at around 2000 on its daily chart. As long as the price is above the trend line, the price action from the May 25 high of 2737 could be treated as consolidation of the uptrend and another rise towards 3000 psychological important level is possible after the consolidation. Key resistance is at 2738, a break above this level could signal resumption of the uptrend. However, a clear break below the trend line support could take price back to test the key support at 1737, only a breakdown below this level could indicate that the bullish movement from 905 had completed at 2889 already, then the Bitcoin will find next support at 1200 – 1300 area.
Technical levels
Support levels: 2365 (the bottom trend line of the triangle pattern), 2314 (near term support), 2251 (the June 15 low), 2000 (the bullish trend line on the daily chart), 1737 (the May 27 low, key support), 1200 – 1300.
Resistance levels: 2515 (the top trend line of the triangle pattern), 2549 (near term resistance), 2738 (the June 21 high, key resistance), 2889 (the June 12 high), 3000 (psychological important level).