
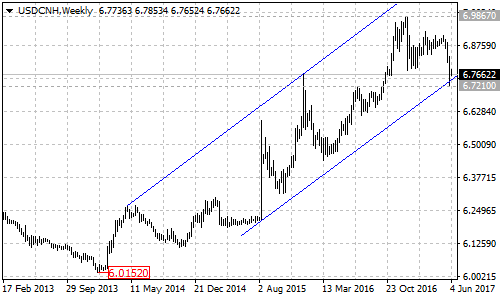
After touching the bottom support trend line of the price channel on the weekly chart, USDCNH rebounded strongly from 6.7210 to 6.7918, indicating that a short term bottom had been formed.
Will the downtrend continue?
There is a bearish trend line from the May 24 high of 6.8876 to the May 31 high of 6.8351 with resistance at around 6.7940 on its 4-hour chart. As long as the pair is below the trend line, the bearish movement from the May 9 high of 6.9171 is possible to continue, and next target would be at around 6.6500. Near term support is at the 61.8% Fibonacci retracement taken from 6.7210 to 6.7918 at 6.7480, followed by 6.7210. Only break below these levels could signal resumption of the bearish movement.
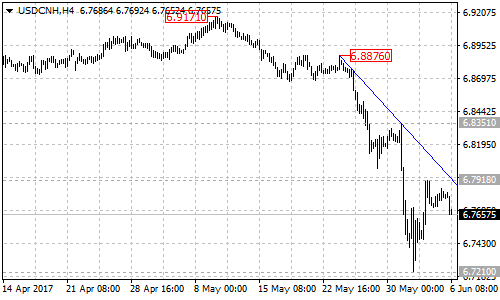
On the upside, a clear break above the trend line resistance will suggest that the bearish movement from 6.9171 had completed at 6.7210 already, then further rally to test 6.8351 resistance could be seen. A break through this level will confirm that the whole correction pullback started from January 2017 high of 6.9867 is complete, this could trigger another rise towards 7.0000.
In our view
The USDCNH pair had reached the bottom of the long term bullish channel on its weekly chart and strong rebound had occurred after touching the channel support, so the correction pullback from 6.9867 might had completed at 6.7210 already. Further rally would more likely be seen in the near future.
Technical levels
Support levels: 6.7480 (Fibonacci retracement), 6.7210 (June 1 low), 6.6500.
Resistance levels: 6.7918 (June 2 high), 6.7940 (trend line resistance), 6.8351 (May 31 high), 6.9171 (May 9 high), 6.9867 (January 2017 high).