
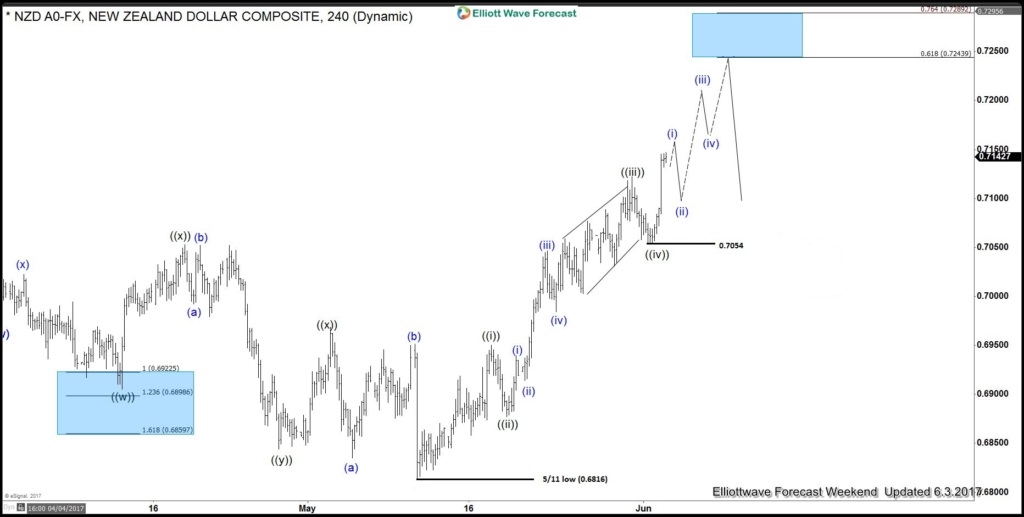
Short term Elliott wave view in NZDUSD suggest that the cycle from 5/11 low (0.6816) is unfolding as an impulsive Elliott wave structure . This 5 wave move could be a wave C of a FLAT correction or wave A of an Elliott wave zigzag structure structure. In either case, after 5 wave move ends, pair should pull back in 3 waves at least as the Elliott Wave Theory suggests. The Minute wave ((i)) ended at (0.6948), Minute wave ((ii)) pullback ended at (0.6880), Minute wave ((iii)) at 0.7121 peak, Minute wave ((iv)) pullback ended at (0.7054) low. Above from there Minute wave ((v)) of C or A already reached the minimum extension area in between inverse 1.236-1.618% extension area of previous wave ((iv)) already at 0.7135-0.7161 area. Which means cycle from 5/11 low (0.6816) is mature and pair can start the 3 waves pullback at any moment.
However as far as dip remains above wave ((iv)) dip (0.7054) & more importantly while the Rsi divergence at the peak stays intact pair may see further advance towards ((v))=((i)) target area at 0.7186-0.7217 area or in case of further strength pair may see 0.618-0.764% fibonacci Extension area of wave ((i))+((iii)) at 0.7243-0.7289 before ending the 5 waves impulse sequence from 5/11 low. Afterwards pair should pullback in 3, 7 or 11 swings for the correction of 5/11 cycle or If the decline turns out to be stronger than expected and breaks the pivot at 5/11 low (0.6816) then that would suggest 5 wave move up from 0.6816 low was part of a wave C of a FLAT from 3/09 (0.6889) low and pair may resume lower.
NZDUSD 4 Hour Elliott Wave Chart
Source : https://elliottwave-forecast.com/forex/nzdusd-elliott-wave-view-showing-impulse