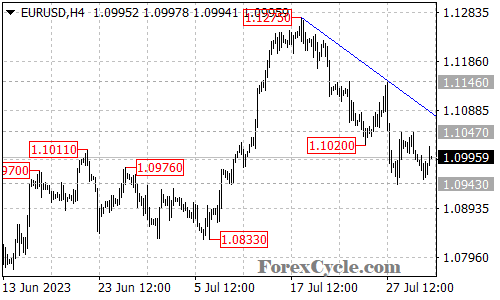
EURUSD has been trading within a range between 1.0943 and 1.1047, displaying a sideways movement.
As long as the price remains below the descending trend line on the 4-hour chart, it is likely that the sideways movement is a period of consolidation for the downtrend starting from 1.1275. A breakdown below the support level at 1.0943 could potentially trigger a further downside move towards the next support levels at 1.0900 and 1.0833, which represents the previous low.
On the upside, if the price manages to break above the resistance level at 1.1047, it could potentially lead to a retest of the falling trend line resistance. Breaking above the trend line would indicate that the downside move has already concluded at 1.0943, potentially paving the way for another rise towards the resistance level at 1.1275.
In summary, the current analysis suggests that EURUSD is trading within a range, with potential downside targets if the support level at 1.0943 is broken. Conversely, breaking above the resistance level at 1.1047 could signal a reversal of the downtrend, with a target towards the resistance at 1.1275. Traders should monitor the price’s behavior around the trend line and these key levels for decisive movements.