ForexCycle.com
  • Home
  • Forex Analysis
    • Long Term Forex Analysis
    • Short Term Forex Analysis
    • Special Focus
    • Daily Forex Reports
    • Forex Signals
  • Forex Articles
    • Market Cycle
    • Indicator
    • Elliott Wave
    • Fibonacci Sequence
    • Forex Market
    • Forex Trading
    • Technical Analysis
    • Chart Pattern
  • Trading Strategy
  • Forex Brokers
    • Avatrade
    • Broker News
    • Broker Review
  • Elliott Wave Courses
    • Markets Reverse
    • 5 Ways Using Trendlines
    • Overview of MACD
    • Relative Strength Index
    • Japanese Candlesticks
    • Moving Averages
    • Fibonacci Ratios
    • Two-Bar Pattern
    • Market Myths Exposed
  • Contact Us

USDCAD Daily Analysis – April 28, 2017

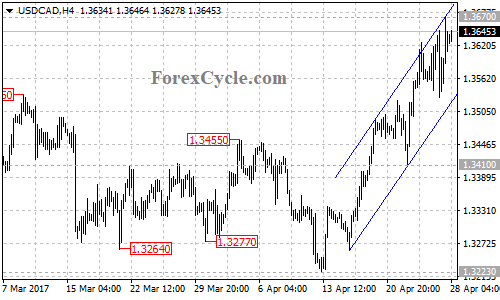
USDCAD’s upward movement from 1.3223 extended to as high as 1.3670. Further rise is still possible in a couple of days and next target would be at 1.3800 area. Support is at the bottom of the price channel on 4-hour chart, only a clear break below the channel support could signal completion of the uptrend.

USDCAD chart

Author ForexCycle.comPosted on April 28, 2017April 28, 2017Categories Short Term Forex AnalysisTags Price Channel, USDCAD

Post navigation

Previous Previous post: USDJPY Daily Analysis – April 28, 2017
Next Next post: USDJPY Downtrend Pullback (Apr 28, 2017)

Resources

  • Unlock Your Trading Potential with EA Builder
  • Elliott Wave Principle

Recent Posts

  • GBPUSD Calling the Rally After Elliott Wave Double Three Pattern
  • Elliott Wave Outlook: Microsoft (MSFT) Surges to Record High, Sustaining Bullish Momentum
  • Global Payments Inc. (GPN) Weekly Elliott Wave Analysis
  • TJX Companies (TJX): Is Bigger Rally Ahead After This Pullback?
  • Silver (XAGUSD) Rallies 29% Following April Blue Box Buy Zone
  • Alphabet Inc. $GOOGL Pullbacks Finding Buyers at Extreme Areas
  • DLF Ltd Elliott Wave Update: Stock Unfolding Its Final Impulsive Leg Toward New Highs
  • GBPUSD Elliott Wave: Forecasting the Rally from the Intraday Equal Legs
  • EURUSD Elliott Wave Outlook: Rally Unfolding from Equal Legs Support
  • Soybeans (ZS_F) Forecasting the Rally After Elliott Wave Zig Zag Pattern
  • Facebook
  • Instagram
  • Twitter
  • LinkedIn
  • Telegram
  • Home
  • Forex Analysis
  • Forex Articles
  • Contact Us
  • Forex Blog
  • Disclaimer
  • Forex Resources
  • Archives
  • RSS
Copyright © 2005 - 2025 ForexCycle.com. All rights reserved.