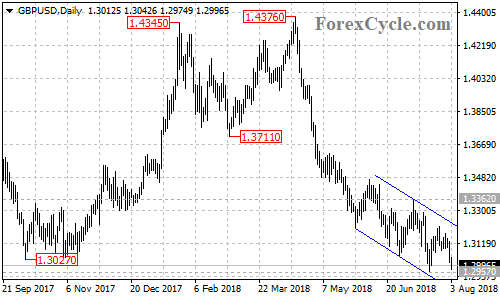
GBPUSD is facing 1.2957 support, a breakdown below this level could take the price to 1.2750 area. Near term resistance is at the top trend line of the price channel on the daily chart, as long as the channel resistance holds, the downtrend from 1.4376 will continue. However, a breakout of the channel resistance could bring the price back to test 1.3362 key resistance, only a break of this level could signal completion of the downtrend.