
Hello traders, and welcome back to my blog. Today we’re diving into the XLY ETF—what it represents, how the EWF team has successfully forecasted and traded it, and what we anticipate moving forward. Let’s jump right in.
What is the ETF All About?
The XLY is the ticker symbol for the Consumer Discretionary Select Sector SPDR Fund, one of the most popular exchange-traded funds (ETFs) used to track the performance of the U.S. consumer discretionary sector.
XLY is managed by State Street Global Advisors and focuses on S&P 500 companies such as Amazon and Tesla. These are businesses in the consumer discretionary sector—selling “non‑essential” goods and services like cars, luxury products, and vacations that people typically buy when they have extra disposable income.
Why Investors Use It?
Economic Indicator: XLY is often watched as a barometer for the health of the U.S. consumer. When XLY is rising, it typically suggests consumers feel confident enough to spend on discretionary items.
Growth Exposure: With heavy weights in Amazon and Tesla, it often behaves more like a growth fund than a traditional retail fund.
Tactical Trading: Traders use it to “rotate” into or out of the consumer sector based on interest rate changes or economic cycles.
Forecasting the Bounce in the Blue box
Today we’re revisiting how our Elliott Wave technical analysis precisely identified the recent bottom in XLY, giving our members the chance to benefit from the ensuing recovery. In trading, timing is everything. On March 22, 2026, we highlighted a clear corrective sequence unfolding in the XLY daily chart. As illustrated below, the ETF was completing a complex double‑three (W‑X‑Y) correction from its early‑2026 highs.
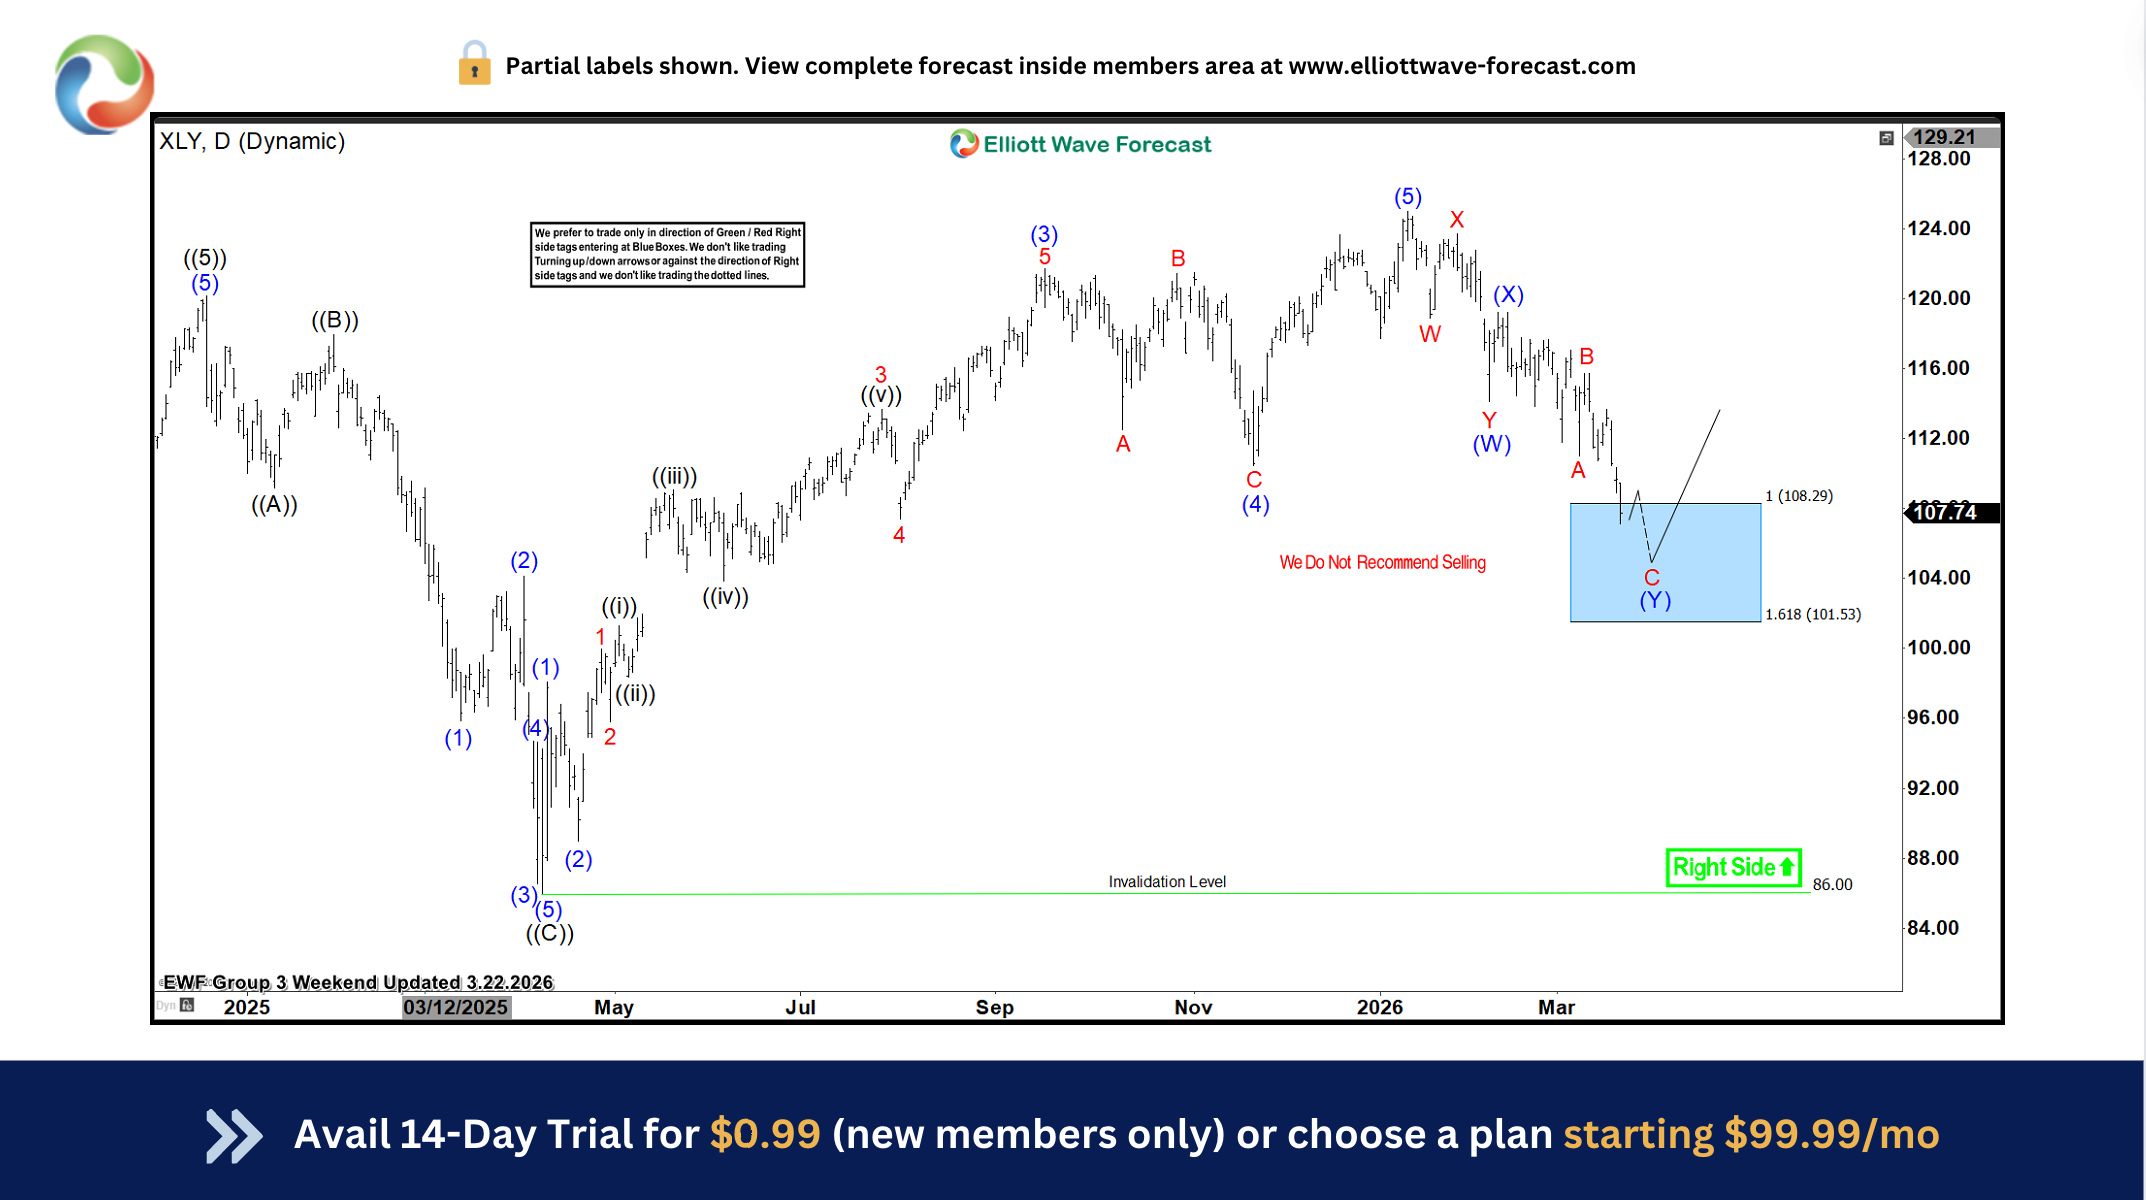
At that point, our forecast was highly specific. We marked out a “Blue Box”—our high‑frequency trading zone where supply and demand typically balance, making a reversal highly probable—between 108.29 and 101.53. Alongside this, our charts carried a clear message: “We Do Not Recommend Selling.” The green “Right Side” arrow pointed decisively higher, underscoring that as long as the invalidation level at 86.05 remained intact, the next major move was expected to unfold to the upside.
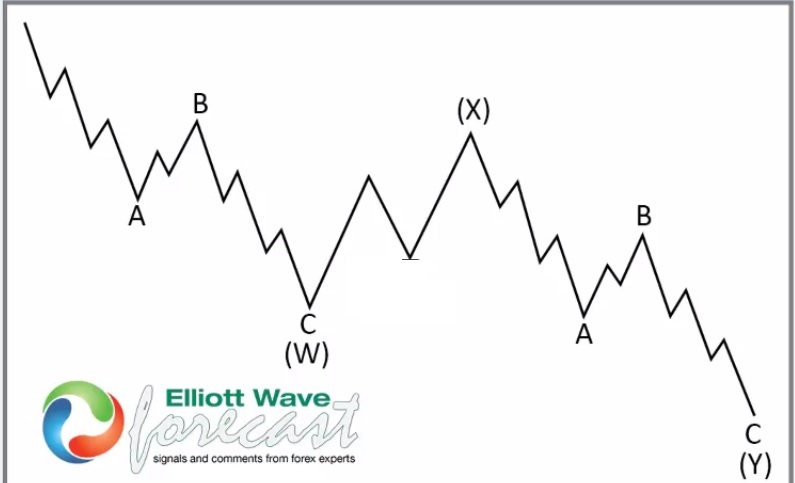
What Is The W-X-Y Structure?
The W‑X‑Y structure is a sideways corrective pattern formed by combining two distinct corrections. Most traders are familiar with individual corrective patterns such as Zigzags, Flat corrections, and Triangles. When two of these patterns are linked together, the result is a double three—commonly labelled W‑X‑Y. Example below image.
The Result: Precision in Action
Fast forward to our update on May 10, 2026. Looking at XLY daily chart image below, you can see exactly how the price action respected our technical boundaries.
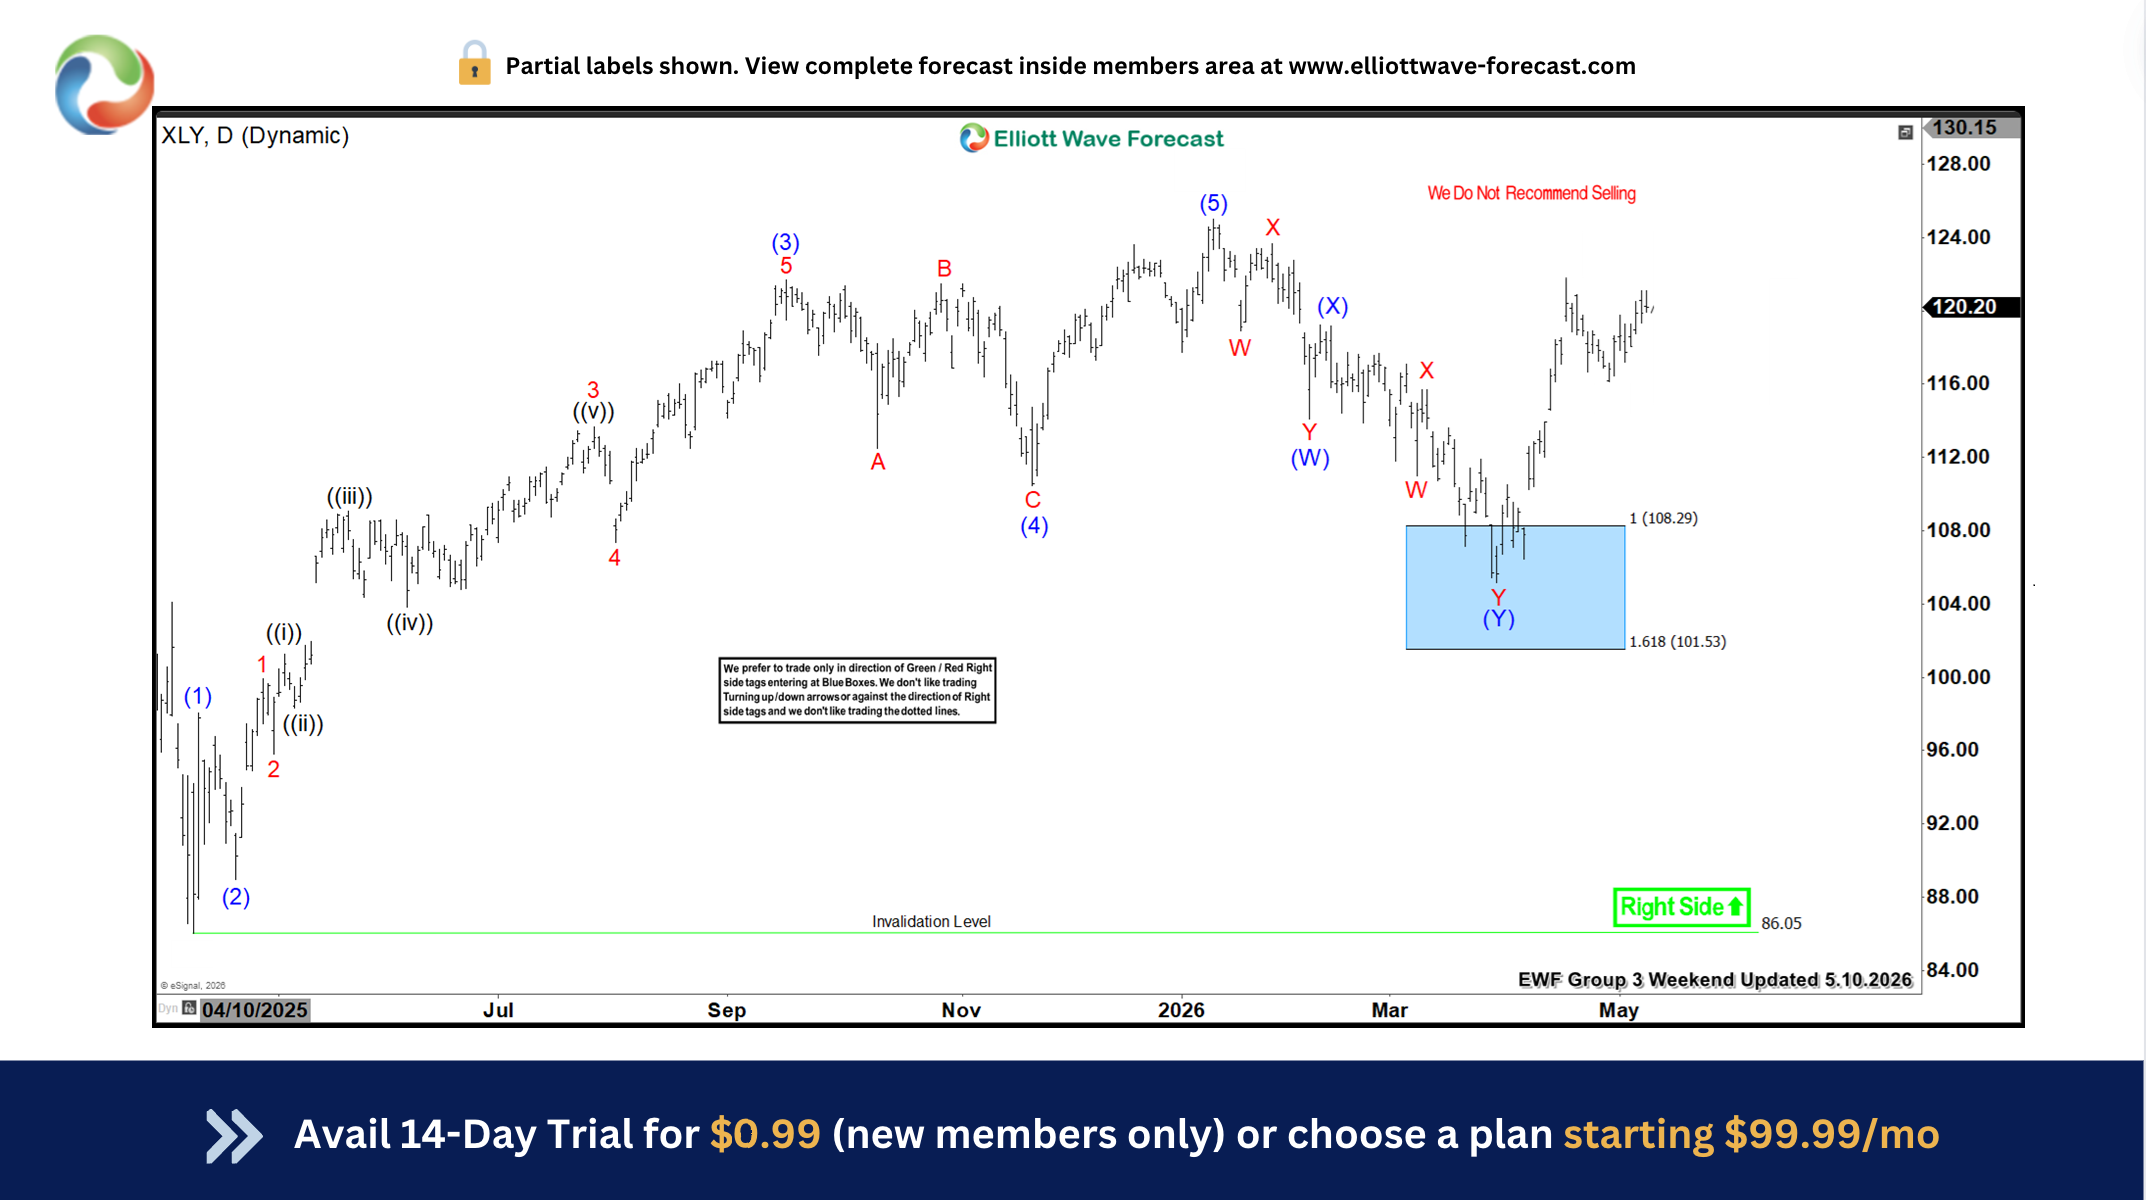
XLY entered the Blue Box exactly as projected, tagging the upper boundary of our target zone before finding strong support. Almost immediately, the ETF completed its “Y” wave correction within that Blue box area and launched into a sharp impulsive rally. The recovery confirmed our forecast, and with price now trading back above the 120.00 level, it validates that our “Right Side” bias was correct all along.
Why It Matters?
By utilizing Elliott Wave Theory, we don’t just guess where the market is going; we identify areas of high-probability exhaustion. In this case, the Blue Box gave our members a clear “buy the dip” opportunity while the rest of the market was likely fearing further breakdowns.
The consumer discretionary sector has shown incredible resilience, and by staying on the right side of the trend, we were able to navigate the volatility with confidence.
What to expect of the ETF going Forward?
As long as the ETF holds above 105.19, any pullbacks in 3 or 7 swings should remain supported, setting the stage for the next leg higher targeting 144.21 – 168.32 area.
Conclusion
The XLY ETF has been a textbook example of how Elliott Wave + disciplined execution can deliver clarity and risk‑controlled trading outcomes. By focusing on high‑probability areas and respecting the larger structure, the EWF Team has successfully forecasted and traded this instrument—and we remain positioned for what comes next.
At Elliottwave Forecast (EWF), we deliver consistent market updates through regular charts update. Our analysts update 1‑hour charts four times daily and 4‑hour charts once per day across all 78 instruments. In addition, we host five live sessions each day and maintain a 24‑hour chatroom, providing clients with real‑time market guidance and answers to any questions they may have.
Source: https://elliottwave-forecast.com/bluebox-wins/xly-bouncing-from-blue-box/