
Vertiv Holdings Co., (VRT) is provider of critical infrastructure & services for data centers, communication networks & commercial & industrial environments. It comes under Industrials sector & trades as “VRT” ticket for NYSE.
VRT favors impulse sequence in ((1)) of I of (III) after (II) pullback ended at $53.60 low in April-2025. It favors upside in (5) of ((1)) & soon pullback in ((2)), which provides buying opportunity later.
VRT – Elliott Wave Latest Daily View:
In weekly since March-2020 low, it ended (I) at $155.84 high in January-2025 & (II) at $53.60 low in April-2025. Within (I), it ended I at $28.80 high, II at $7.76 low, III at $109.27 high, IV at $62.40 low & V at $155.84 high. In III, it placed ((1)) at $17.88 high, ((2)) at $11.95 low, ((3)) at $88.69 high, ((4)) at $72.58 low & ((5)) at $109.27 high. It ended ((A)) of IV at $85.14 low, ((B)) as flat at $95.48 high & ((C)) at $62.40 low in daily blue box area. Above there, it ended ((1)) at $83.75 high, ((2)) at $71.12 low, ((3)) at $145.67 high, ((4)) at $112.23 low & ((5)) at $155.84 high as V of (I).
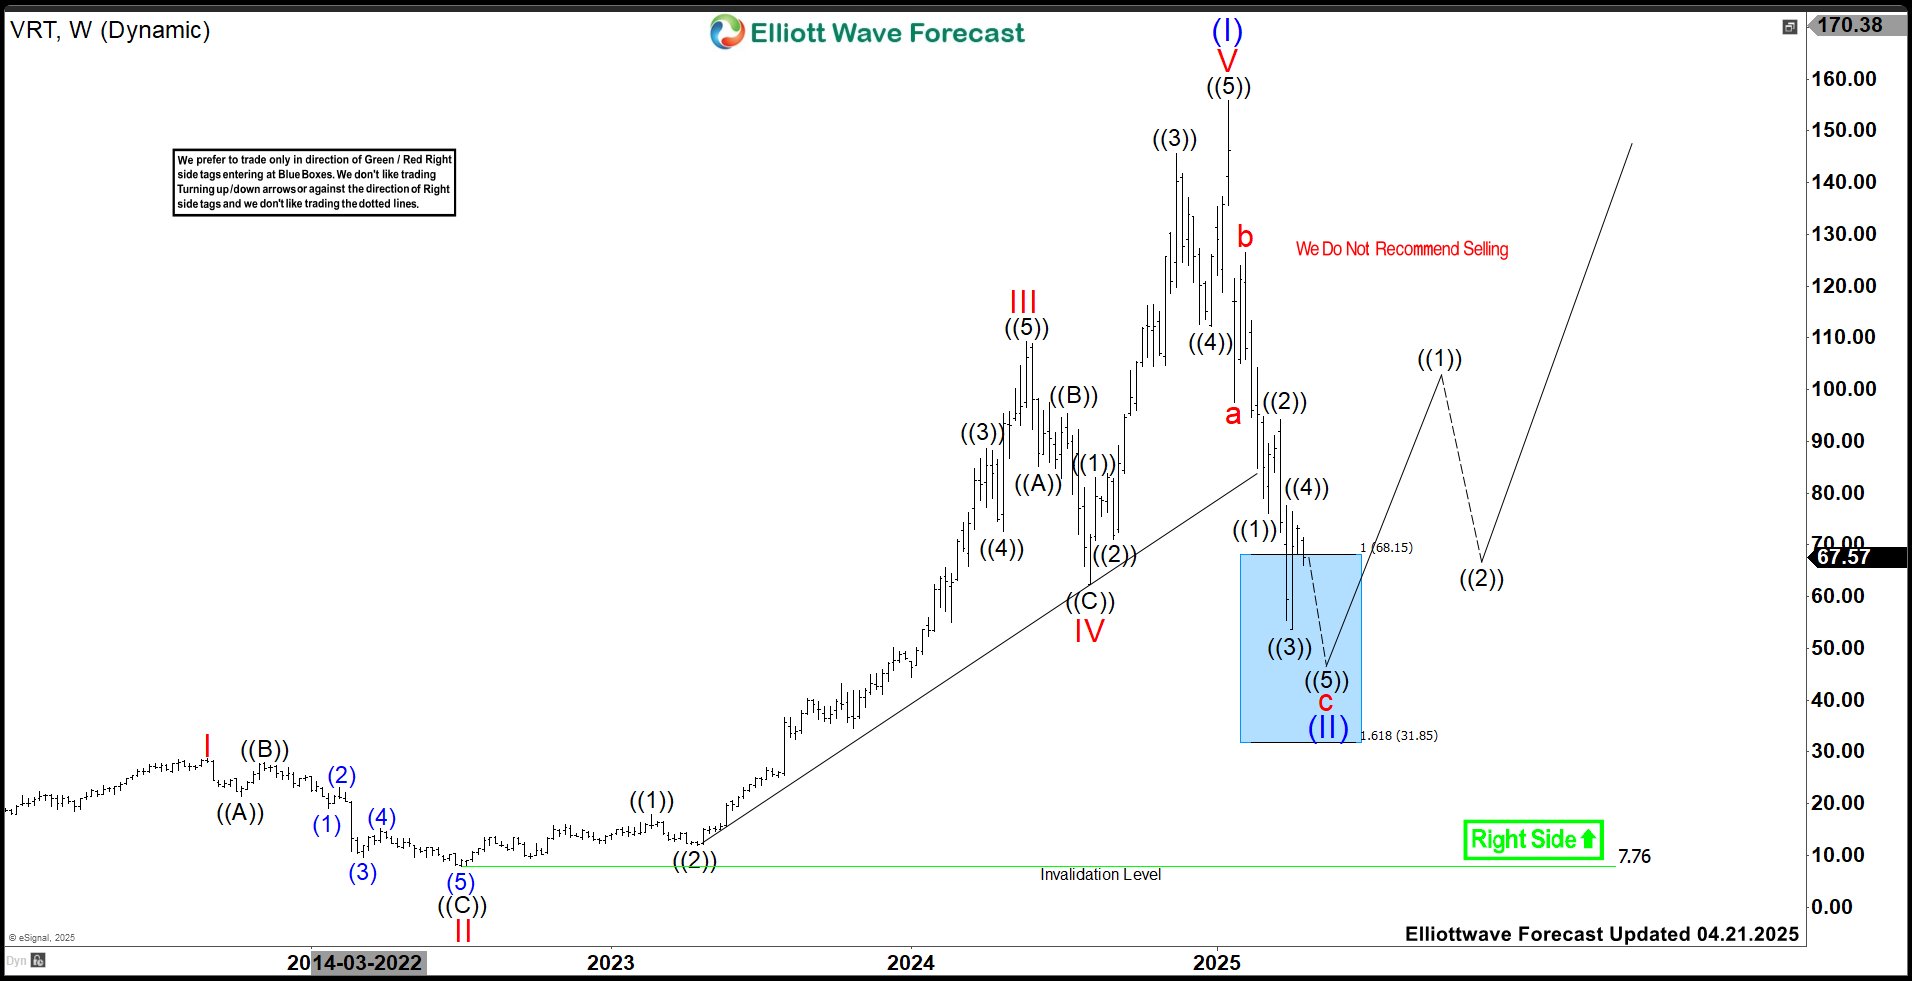
VRT – Elliott Wave Latest Weekly View:
Below (I), it ended a of (II) at $76.10 low, b at $94.20 high & c at $53.60 low in 3 zigzag correction in 4.07.2025. Within a red, it ended ((1)) at $97.50 low, ((2)) at $126.53 high, ((3)) at $84.59 low, ((4)) at $104.21 high & ((5)) at $76.10 low in diagonal structure. Above there, it ended (1) of ((1)) at $70.35 high, (2) at $60.67 low, (3) at $131.38 high, (4) at $110.06 low & favors upside in (5). Within (3), it ended 1 at $76.49 high, 2 at $65.68 low, 3 at $116.62 high, 4 at $107.38 low & 5 at $131.38 high.
VRT – Elliott Wave View From 4.21.2025:
Within (5), it ended 1 at $133.52 high, 2 at $119.10 low, 3 at $153.50 high, 4 proposed ended at $135.35 low & favors upside in 5 of (5). It expects one more push higher above $153.50 to finish ((1)) soon before correcting in ((2)). We like to buy the pullback in ((2)) in 3, 7 or 11 swings against April-2025 low later. Alternative view is that it ended ((1)) at last peak, while ended (4) in flat correction at $119.10 low. In that case, the current bounce should fail below 7.30.2025 high to extend lower in (A) of ((2)). Therefore, chasing the last leg can be risky. The ((2)) ideally corrects between 0.382 – 0.618 Fibonacci retracement of ((1)).
Source: https://elliottwave-forecast.com/stock-market/vertiv-vrt-provide-swing-opportunity/