The Global X Uranium ETF ($URA) is an exchange-traded fund (ETF) that seeks to provide investment results that correspond generally to the price and yield performance of the Solactive Global Uranium & Nuclear Components Total Return Index. In this article, we will look at the long term technical outlook using Elliott Wave method.
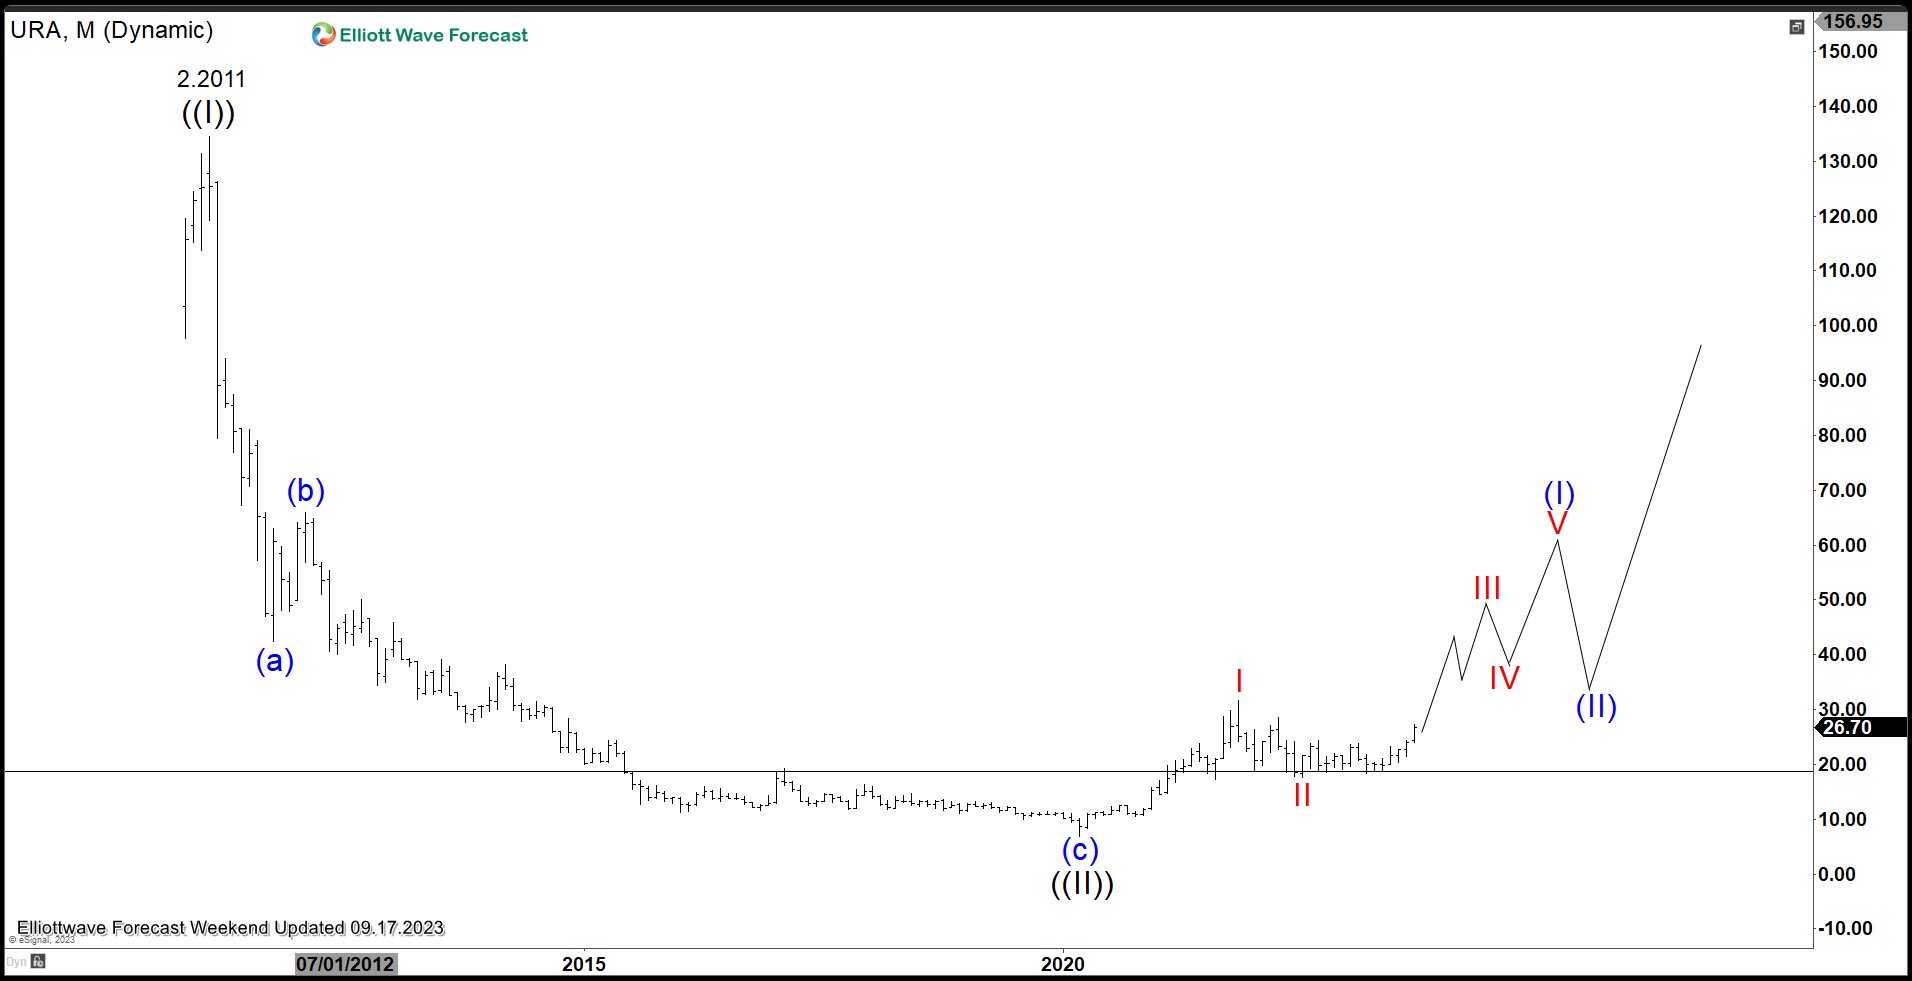
$URA Elliott Wave Chart Monthly Chart

Uranium ETF (URA) Monthly Chart above held up the horizontal support/resistance at $19. The ETF has started to turn higher and should start the next bullish cycle higher. Wave ((II)) ended on March 1, 2020 low at 6.95. Up from there, wave I ended at 31.6 and pullback in wave II ended at 17.65. While pullback stays above 17.65, expect the ETF to continue higher in months and years to come.
$URA Daily Elliott Wave Chart
After forming major low at 6.95 on March 2020, ETF (URA) rallied in wave (1) towards 24.34. Dips in wave (2) ended at 18.31 as a double three. Down from wave (I), wave W ended at 18.47 and rally in wave X ended at 23.86. The ETF then extended lower in wave Y towards 18.31 which completed wave (2). It has resumed higher in wave (3) with internal subdivision as a 5 waves. Up from wave (2), wave 1 ended at 21.12 and dips in wave 2 ended at 18.97. Expect the ETF to continue to extend higher within wave 3.
Source: https://elliottwave-forecast.com/stock-market/uranium-miners-etf-ura-started-next-bullish-cycle/
