
Home Depot (HD), is an American multinational home improvement retail corporation that sells tools, construction products, appliances, and services, including fuel and transportation rentals. Home Depot is the largest home improvement retailer in the United States.
After reaching all-time highs in December 2021, the price of HD fell considerably. According to the Elliott Wave Principle, the stock price should continue to fall. The structure that is developing appears to be a zigzag correction, and if so, it still has a lot of things to say.
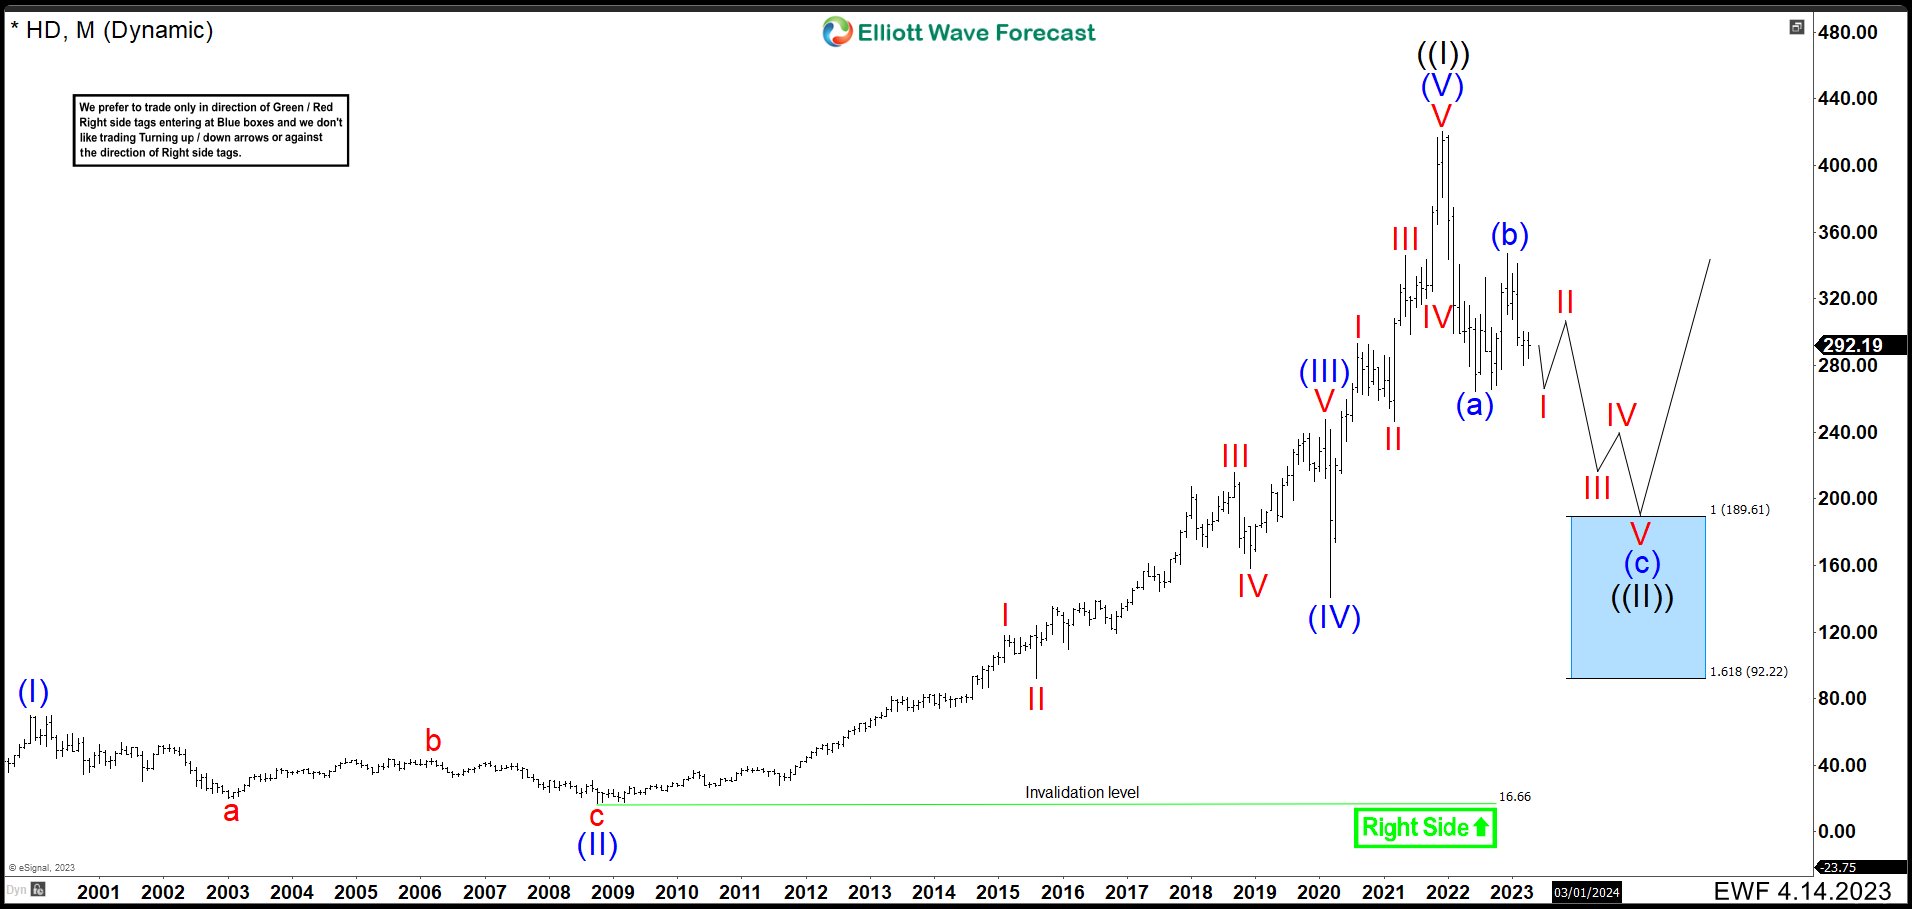
Home Depot HD Monthly Chart April 2023
As we can see above on the monthly chart, HD finished its first grand cycle since the company’s inception in late 1999, reaching $70.08. We called this movement the wave (I). At this price, it entered in a corrective phase that ended in 2008 recession at $16.66. We labeled it as wave (II). Since then, the price kept a strong bullish trend, rising as high as $247.70 to complete wave (III). Then, we clearly see the wave (IV) at the beginning of the COVID19 pandemic, in 2020, when the price fell to $139.84. From here, it had again a strong rebound creating a new impulse, being wave IV as triangle, thus wave V is the shortest of the impulse. This completed wave (V) at $420.79 and wave ((I)) of the grand super cycle in December 2021.
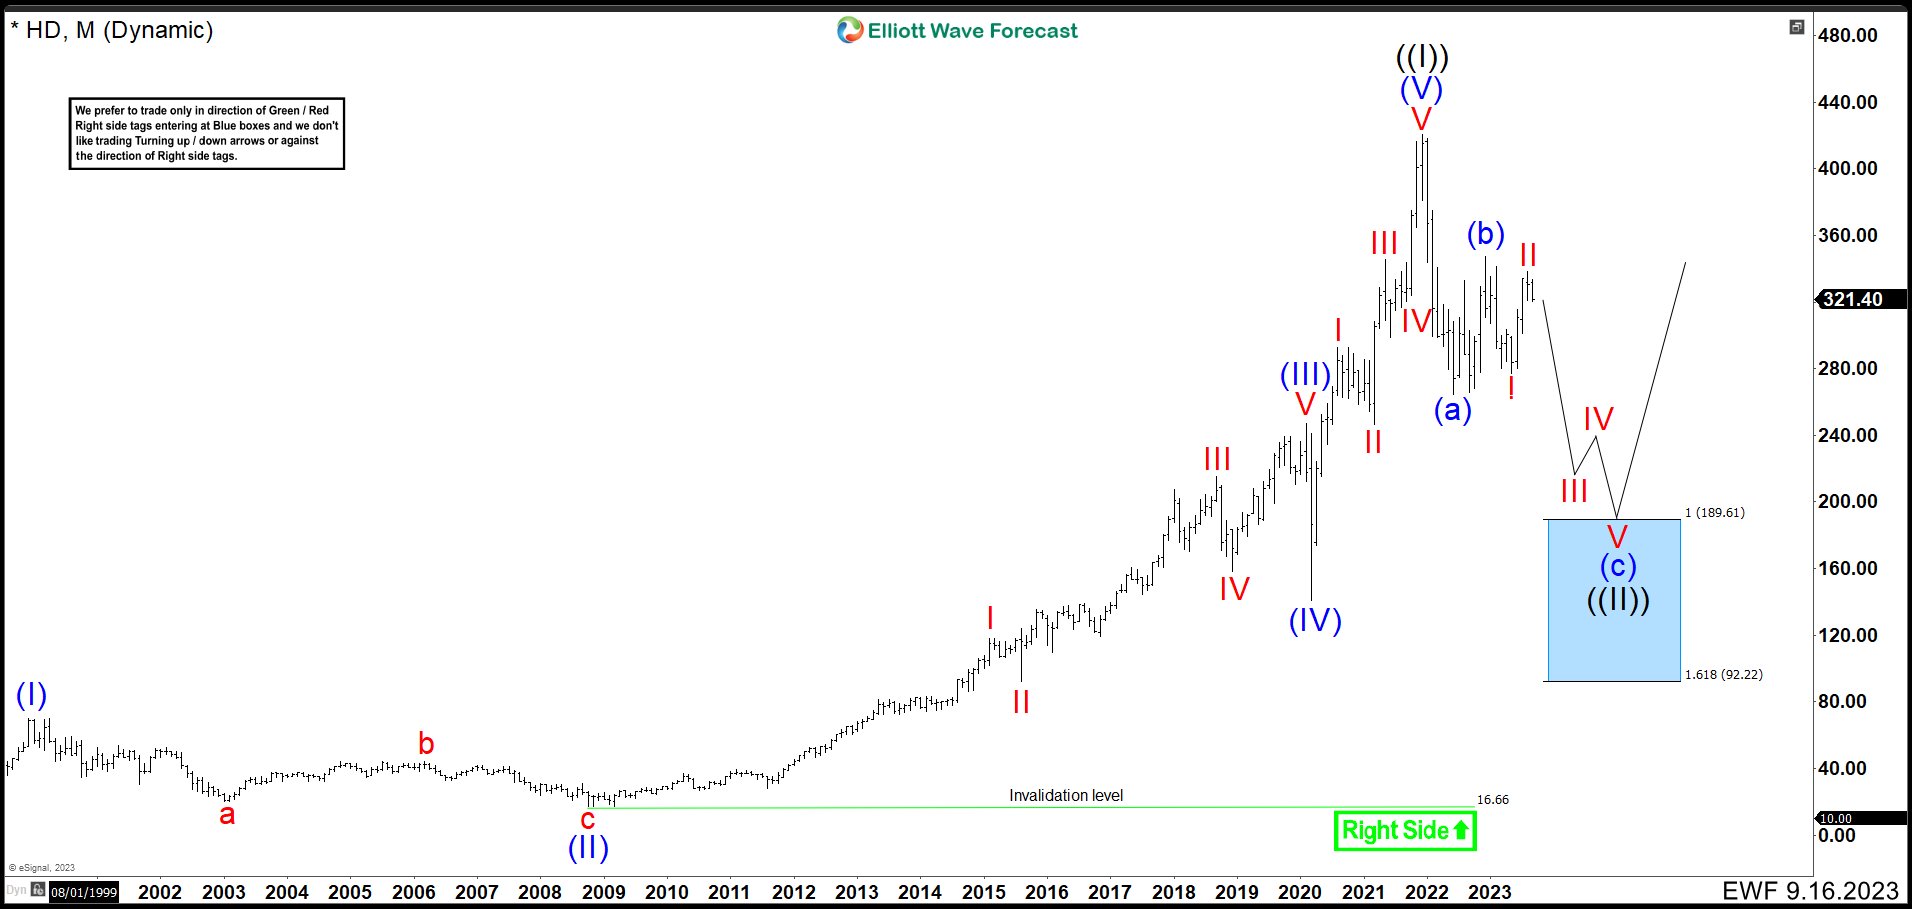
Home Depot HD Monthly Chart September 2023
Since 2021 high, the price of HD has remained bearish and to complete the corrective structure it should continue to decline further. This is because, to finish a corrective structure is needed a minimum of 3 waves where the third wave must break the end of the first wave at least marginally. Suggesting further drops in HD price which it should ideally hit the blue box in $189.61 – $92.22 area. If we see 5 waves down from wave (b) in the blue box, it is a good opportunity to look for longer-term buys. Comparing with April’s chart, wave I ended at $277.09 making one more low. Wave II higher has been very strong ending at $338.17 near to wave (b). From here, we are looking to continue lower.
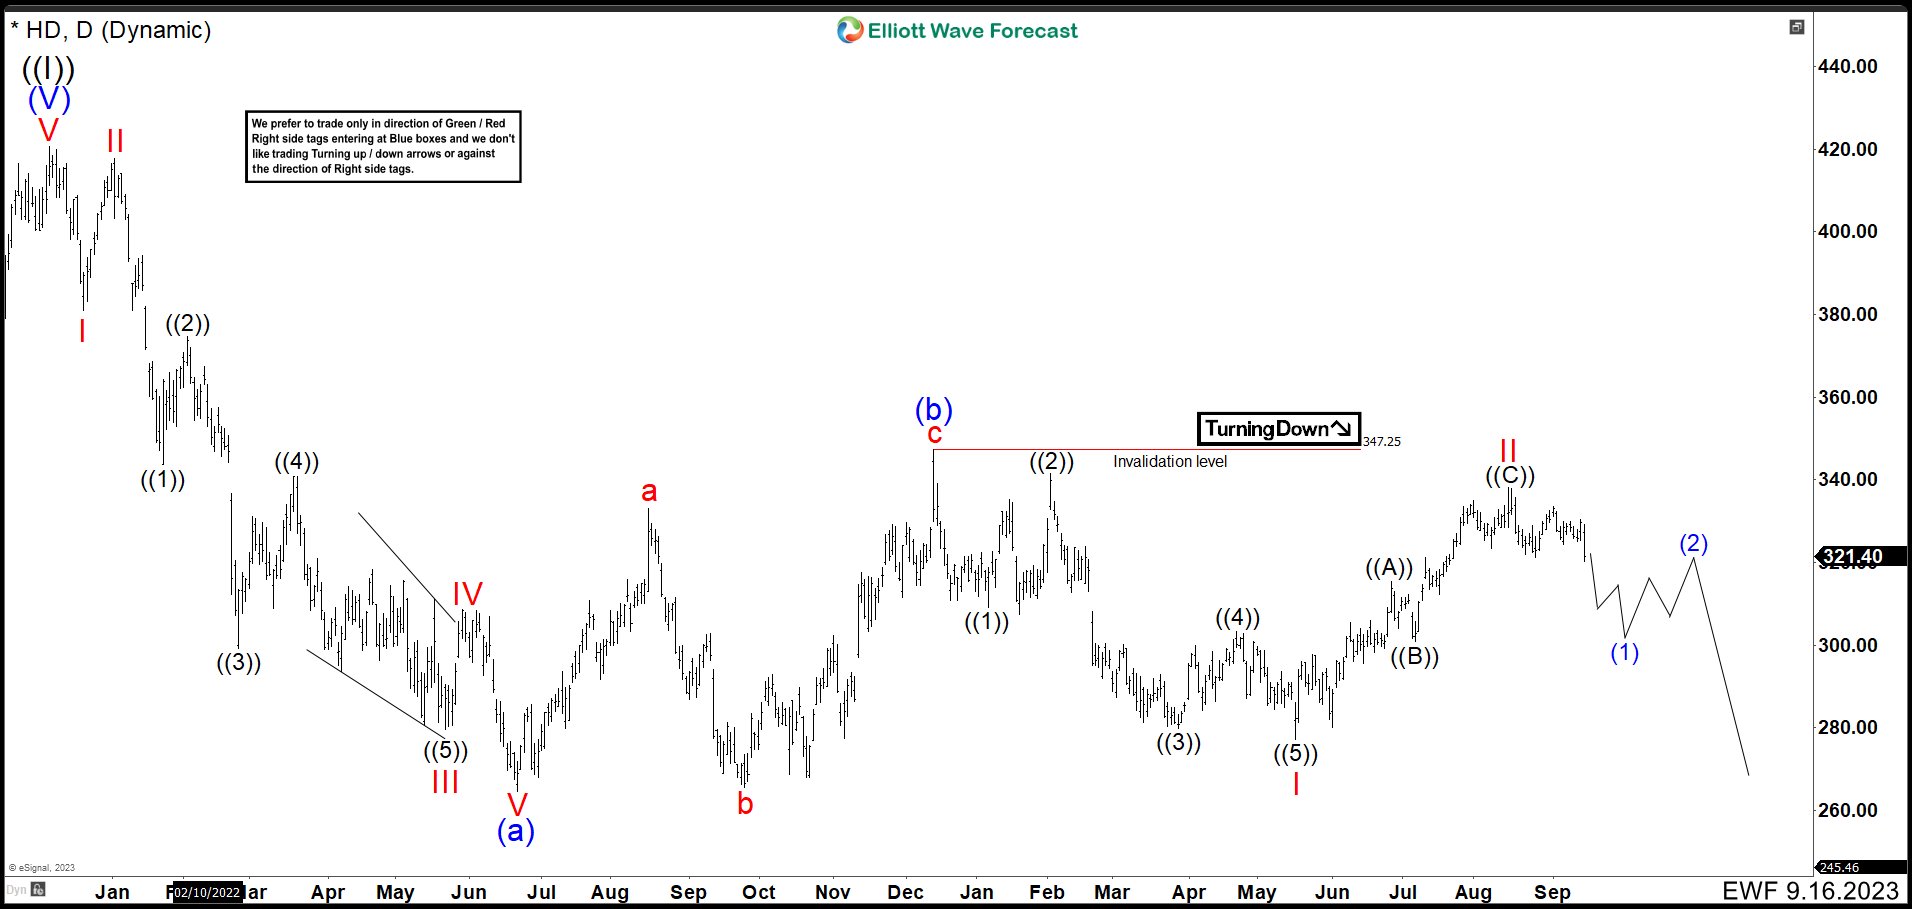
Home Depot HD Daily Chart September 2023
In Daily chart, we can watch closer what is happening with HD price. From $347.25, wave (b) high, there are clearly 5 swings lower to end an impulse as wave I at $277.09 . Then, we have 3 swings higher as a zig zag correction to end wave II at $338.17. As price action stays below $347.35 high, we are calling that market should continue dropping in wave III structure.
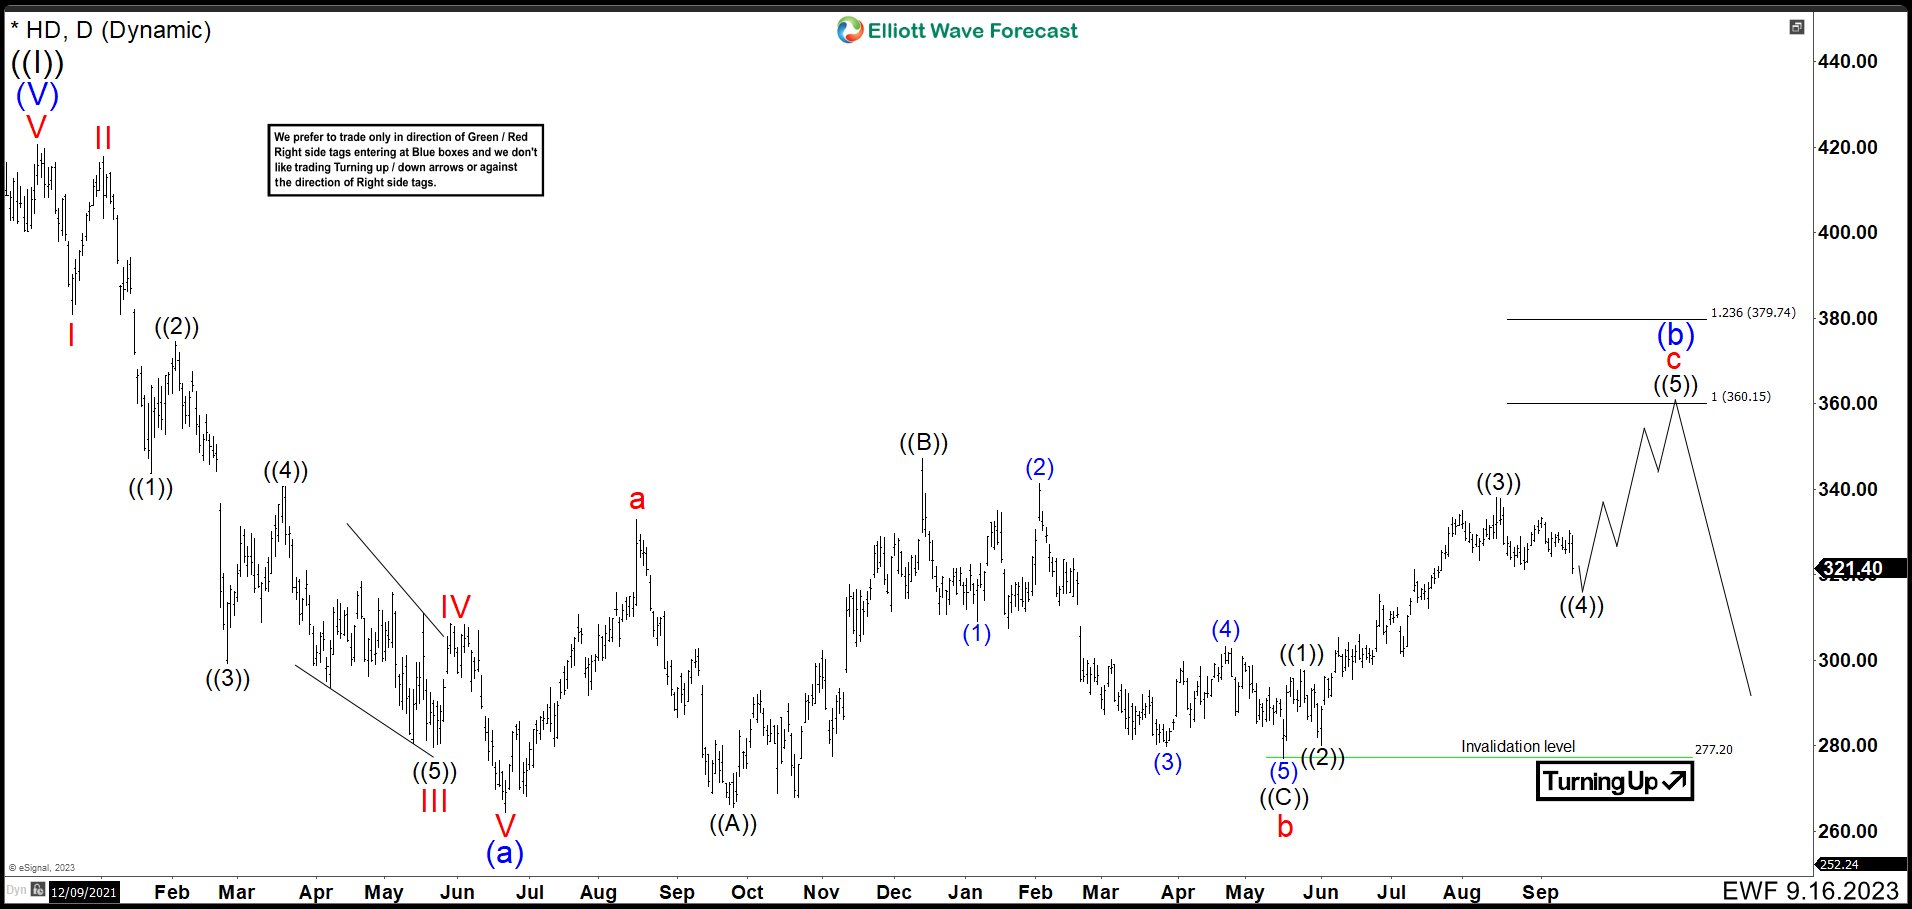
Home Depot HD Alternative Daily Chart September 2023
As alternative view, we are showing the chart above. This would happen, if HD price action breaks above $420.79. That would mean wave (b) is not completed and it needs to build an impulse from $277.09 low. At the end, the structure of wave (b) would be a flat correction. Wave “a” ended at $332.98 high in August 2022. Then wave “b” would be a running flat correction ending at $277.09. Last rally as wave “c” would complete the structure of wave (b) and it should end in 360.15 – 379.74 area before resuming the downtrend to finish wave ((II)) in monthly chart.
Source: https://elliottwave-forecast.com/stock-market/home-depot-hd-crash-elliott-wave/