
Hello everyone! In today’s article, we’ll review the recent performance of Metals & Mining ETF ($XME) through the lens of Elliott Wave Theory. We’ll look at how the pullback from all-time highs unfolded as a textbook 3-swing correction and discuss what could come next. Let’s explore the structure and the expectations for this ETF.
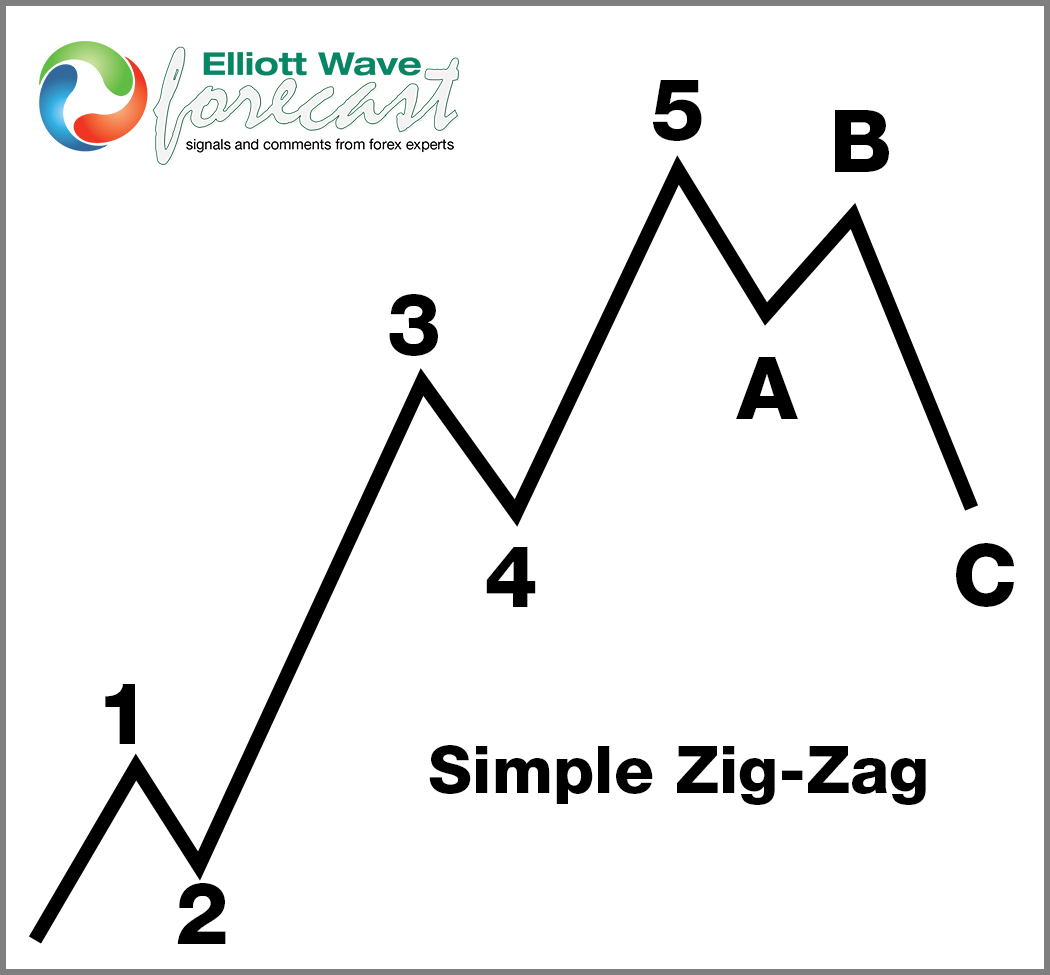
5 Wave Impulse Structure + ABC correction
$XME 1H Elliott Wave Chart 1.30.2026:

In the 1-hour Elliott Wave count from Jan 30, 2026, we saw that $XME completed a 5-wave impulsive cycle at blue (3). As expected, this initial wave prompted a pullback. We anticipated this pullback to unfold in 3 swings, likely finding buyers in the blue box area between $119.25 and $112.01.
This setup aligns with a typical Elliott Wave correction pattern (ABC), in which the market pauses briefly before resuming its primary trend.
$XME 1H Elliott Wave Chart 11.10.2025:

The latest update, from Feb 10, 2026, shows that the ETF bounced as predicted. Currently, it is trading higher in wave (3) of ((1)) looking for continuation higher towards new ATHs to finish 5 waves from the Jan 30th low.
Conclusion
To conclude, our Elliott Wave analysis of Metals & Mining ETF ($XME) suggests that it remains supported against Jan 2026 lows. Thus, traders that bought the dip should get risk free by booking half profits and moving the stop loss to the recent low. Additionally, keep an eye out for any corrective pullbacks that may offer entry opportunities.
By applying Elliott Wave Theory, traders can better anticipate the structure of upcoming moves and enhance risk management in volatile markets.