
Hello everyone. In today’s article, we will look at the past performance of the 1 Hour Elliott Wave chart of Exxon Mobil Corp ($XOM). The rally from 7.17.2022 low unfolded as a 5 wave impulse. So, we expected the pullback to unfold in 3 swings and find buyers again. We will explain the structure & forecast below:
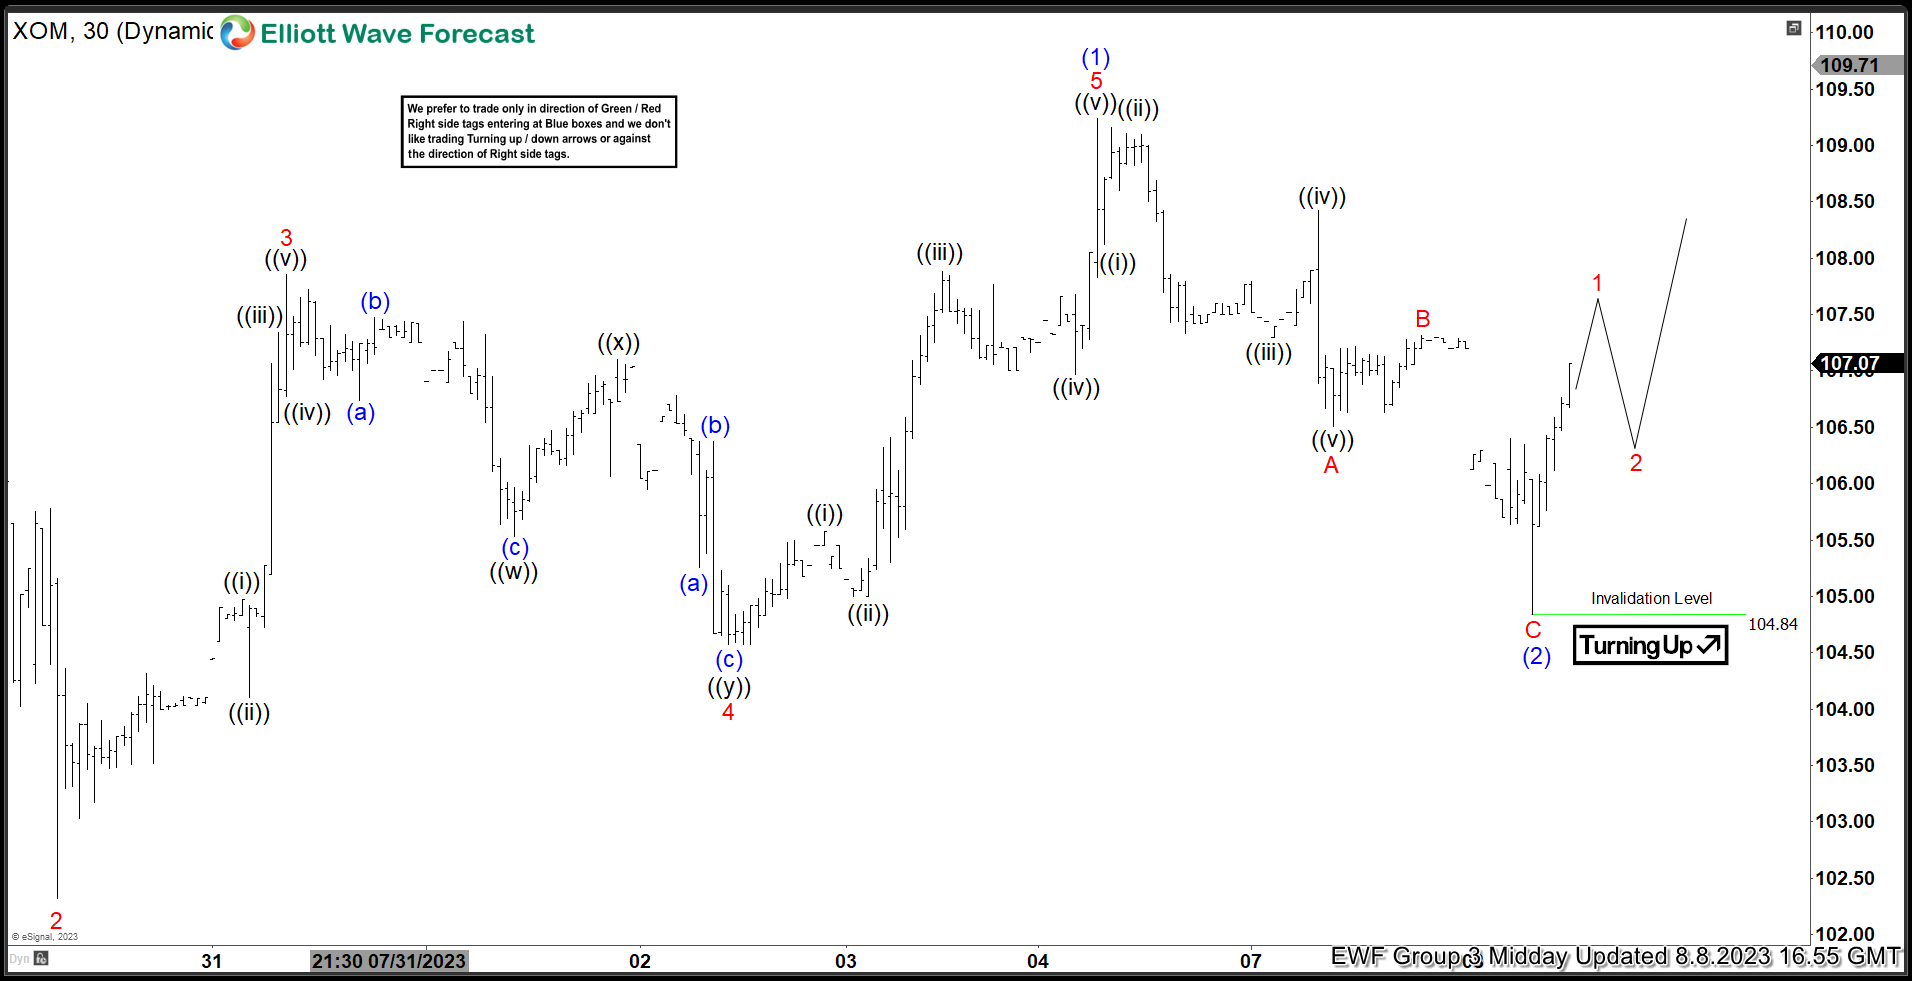
$XOM 1H Elliott Wave Chart 8.8.2023:
Here is the 1H Elliott Wave count from 8.08.2023. The rally from 7.17.2023 peaked at blue (1) and started a pullback to correct it. We expected the pullback to have found a bottom after 3 swings lower at $104.84.
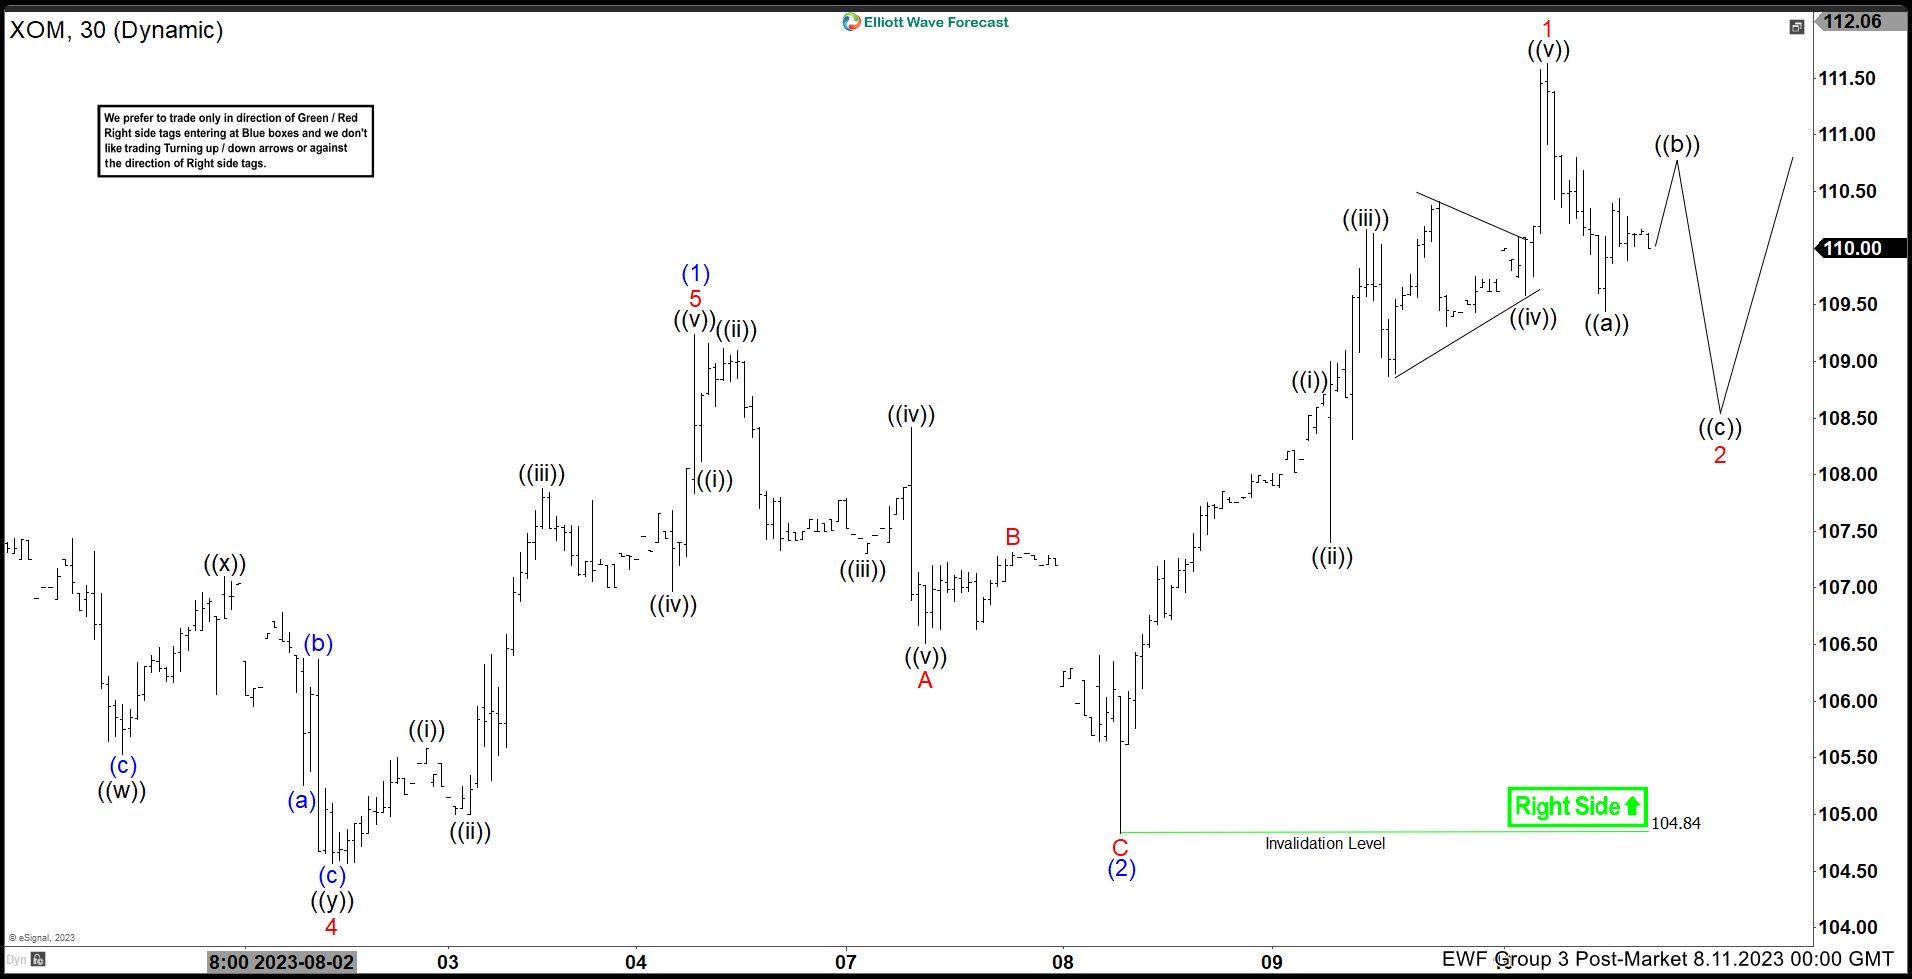
$XOM 1H Elliott Wave Chart 8.11.2023:
Here is the 1H update from 8.11.2023 showing the bounce taking place as expected. The stock has reacted higher after doing 3 swings lower and broke above the blue (1) peak creating a bullish sequence. We expect the stock to print a new high for the year and reach $124 – 132 before a pullback can happen.