
ES_F (E-mini S&P 500) dropped from 4634.50 to 4350 from 7.27.2023 to 8.18.2023. This decline took the form of a zigzag Elliott wave structure. Today, we will take a look at the structure of the decline from 7.27.2023 peak and how we spotted this zigzag structure and forecasted another leg lower in ES_F.
Elliott Wave Zigzag is the most popular corrective pattern in Elliott Wave theory. It’s made of 3 swings that have 5-3-5 inner structure. Inner swings are labeled as A,B,C where A =5 waves, B=3 waves, and C=5 waves. That means A and C can be either impulsive waves or diagonals. (Leading Diagonal in case of wave A or Ending in case of wave C) . Waves A and C must meet all conditions of being 5 wave structure, such as: having RSI divergence between wave subdivisions, ideal Fibonacci extensions and ideal retracements.
ES_F 10 August 1 Hour New York Elliott Wave Update
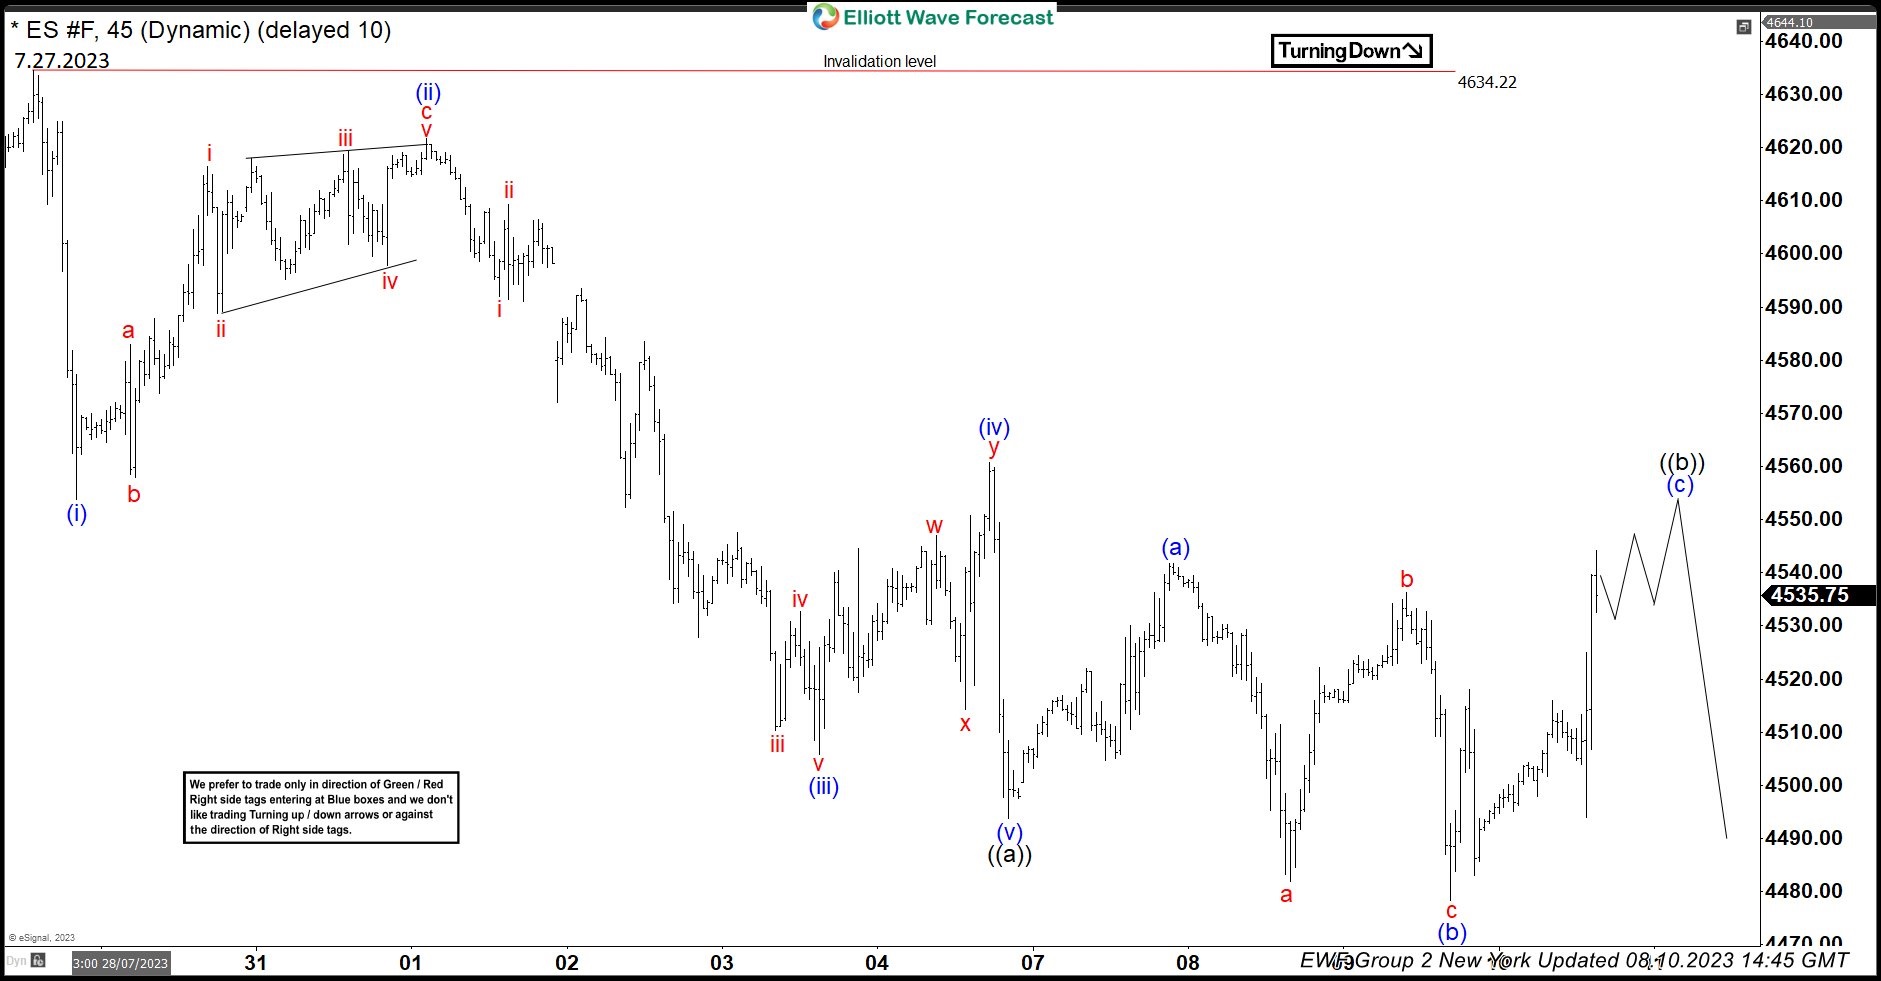
The chart above shows the decline from 4634.50 to 4493.75 took the form of 5 waves when wave (i) ended at 4553.75, wave (ii) ended at 4621.75, wave (iii) ended at 4505.75, wave (iv) ended at 4560.75 and wave (v) of ((a)) ended at 4493.75. This was followed by a bounce to 4541.75 which we labeled as wave (a) and then a new low in 3 waves to 4478.25 which we have labeled as wave (b) because it rallied strongly afterward suggesting it could unfold as a FLAT in wave ((b)) which is a 3-3-5 structure.
ES_F 22 August 1 Hour London Elliott Wave Update
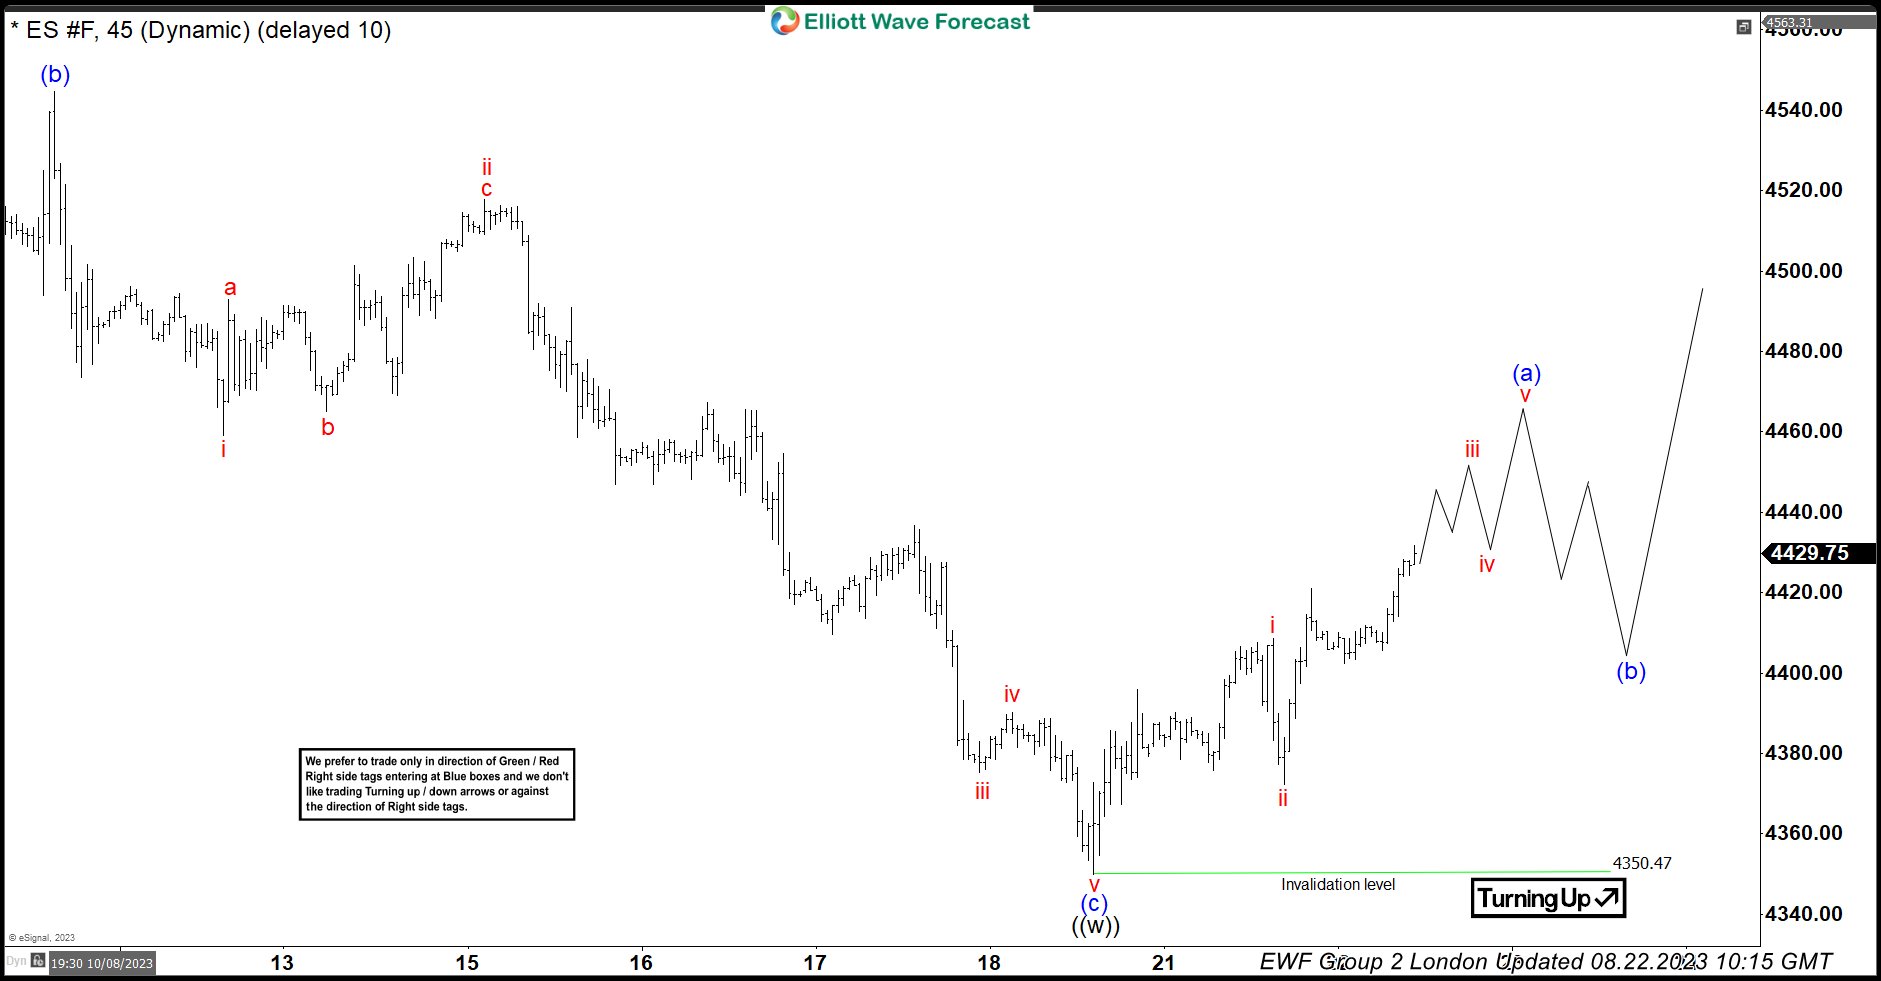
The chart above shows that the decline resumed after the completion of wave (b), we tweaked the labels and called the bounce to be wave (b) instead of wave ((b)) because Hangseng and FTSE broke below the previous lows to an incomplete bearish sequence supporting the idea of more downside against 7.27.2023 high in ES_F as well. We can see Index futures did complete 5 waves down in wave (c) to reach a low of 4350.47 which is just below 123.6% Fibonnacci extension of wave (a) related to wave (b) and has now started bouncing. While above the low at 4350.47, expect at least 1 more leg higher in the Index futures.