
In this technical blog, we will look at the past performance of the 1-hour Elliott Wave Charts of the Cardano ticker symbol: $ADAUSD. The rally from the 10 March 2023 low showed a higher high sequence & provided a short-term extreme trading opportunity. In this case, the pullback managed to reach the equal legs area & provided a buying opportunity. So, we advised members not to sell it but to buy the equal legs area for a minimum reaction higher to happen. We will explain the structure & forecast below:
Cardano 1-Hour Elliott Wave Chart From 04.17.2023
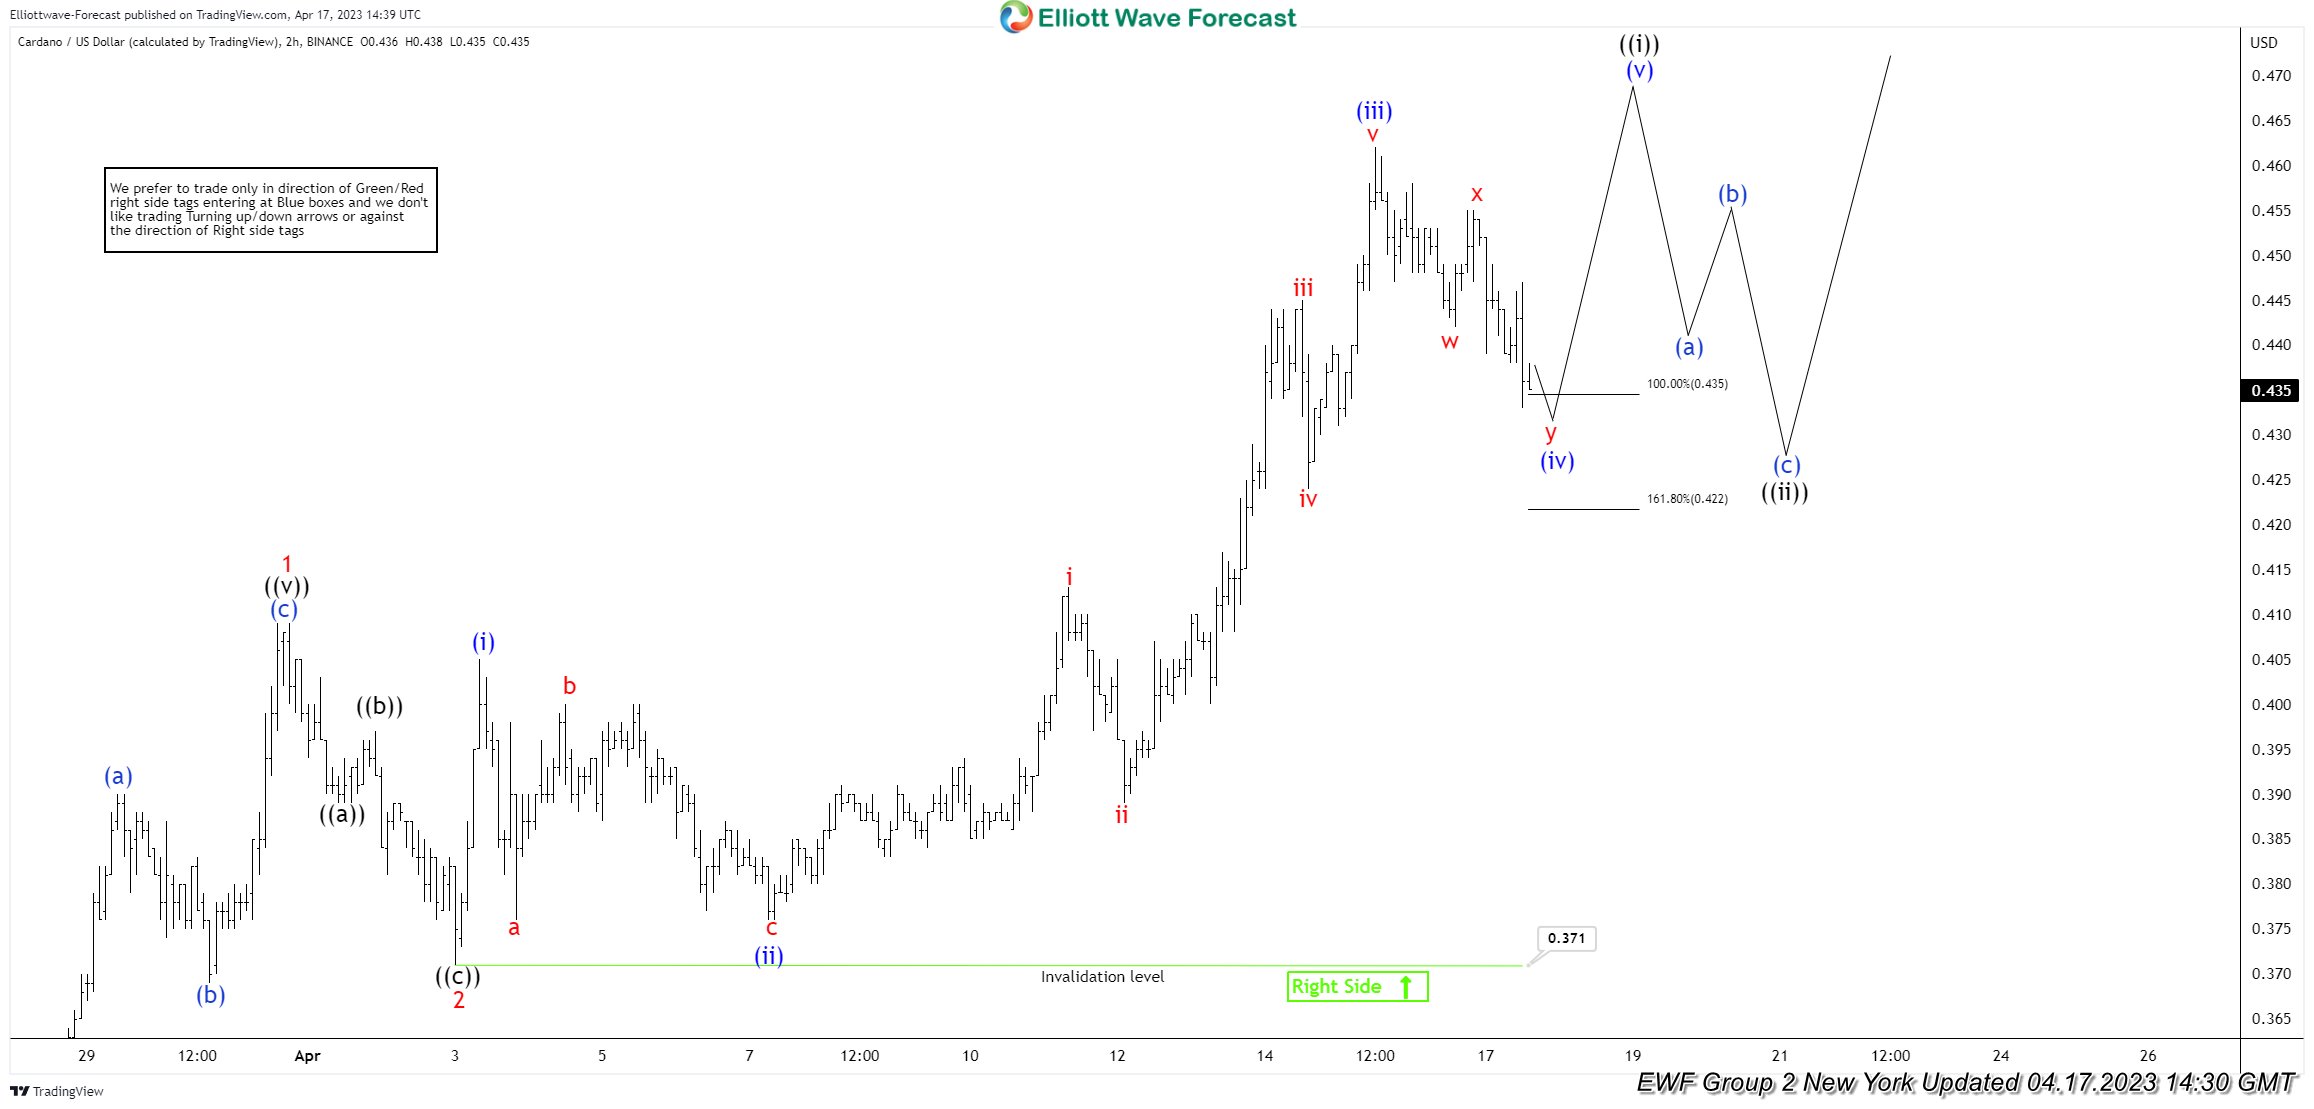
Here’s the Elliott wave Chart from the 04/17/2023 New York update. In which, the rally to $0.462 high ended the wave (iii) & made a pullback in wave (iv). The internals of that pullback unfolded as Elliott wave double three structure where lesser degree wave w ended at $0.442 low. Then a short-term bounce to $0.455 high ended wave x & started the next leg lower in wave y towards $0.435- $0.422 equal legs area. From there, buyers were expected to appear looking for new highs ideally or for a 3-wave bounce minimum.
Cardano Latest 1-Hour Elliott Wave Chart From 04.18.2023
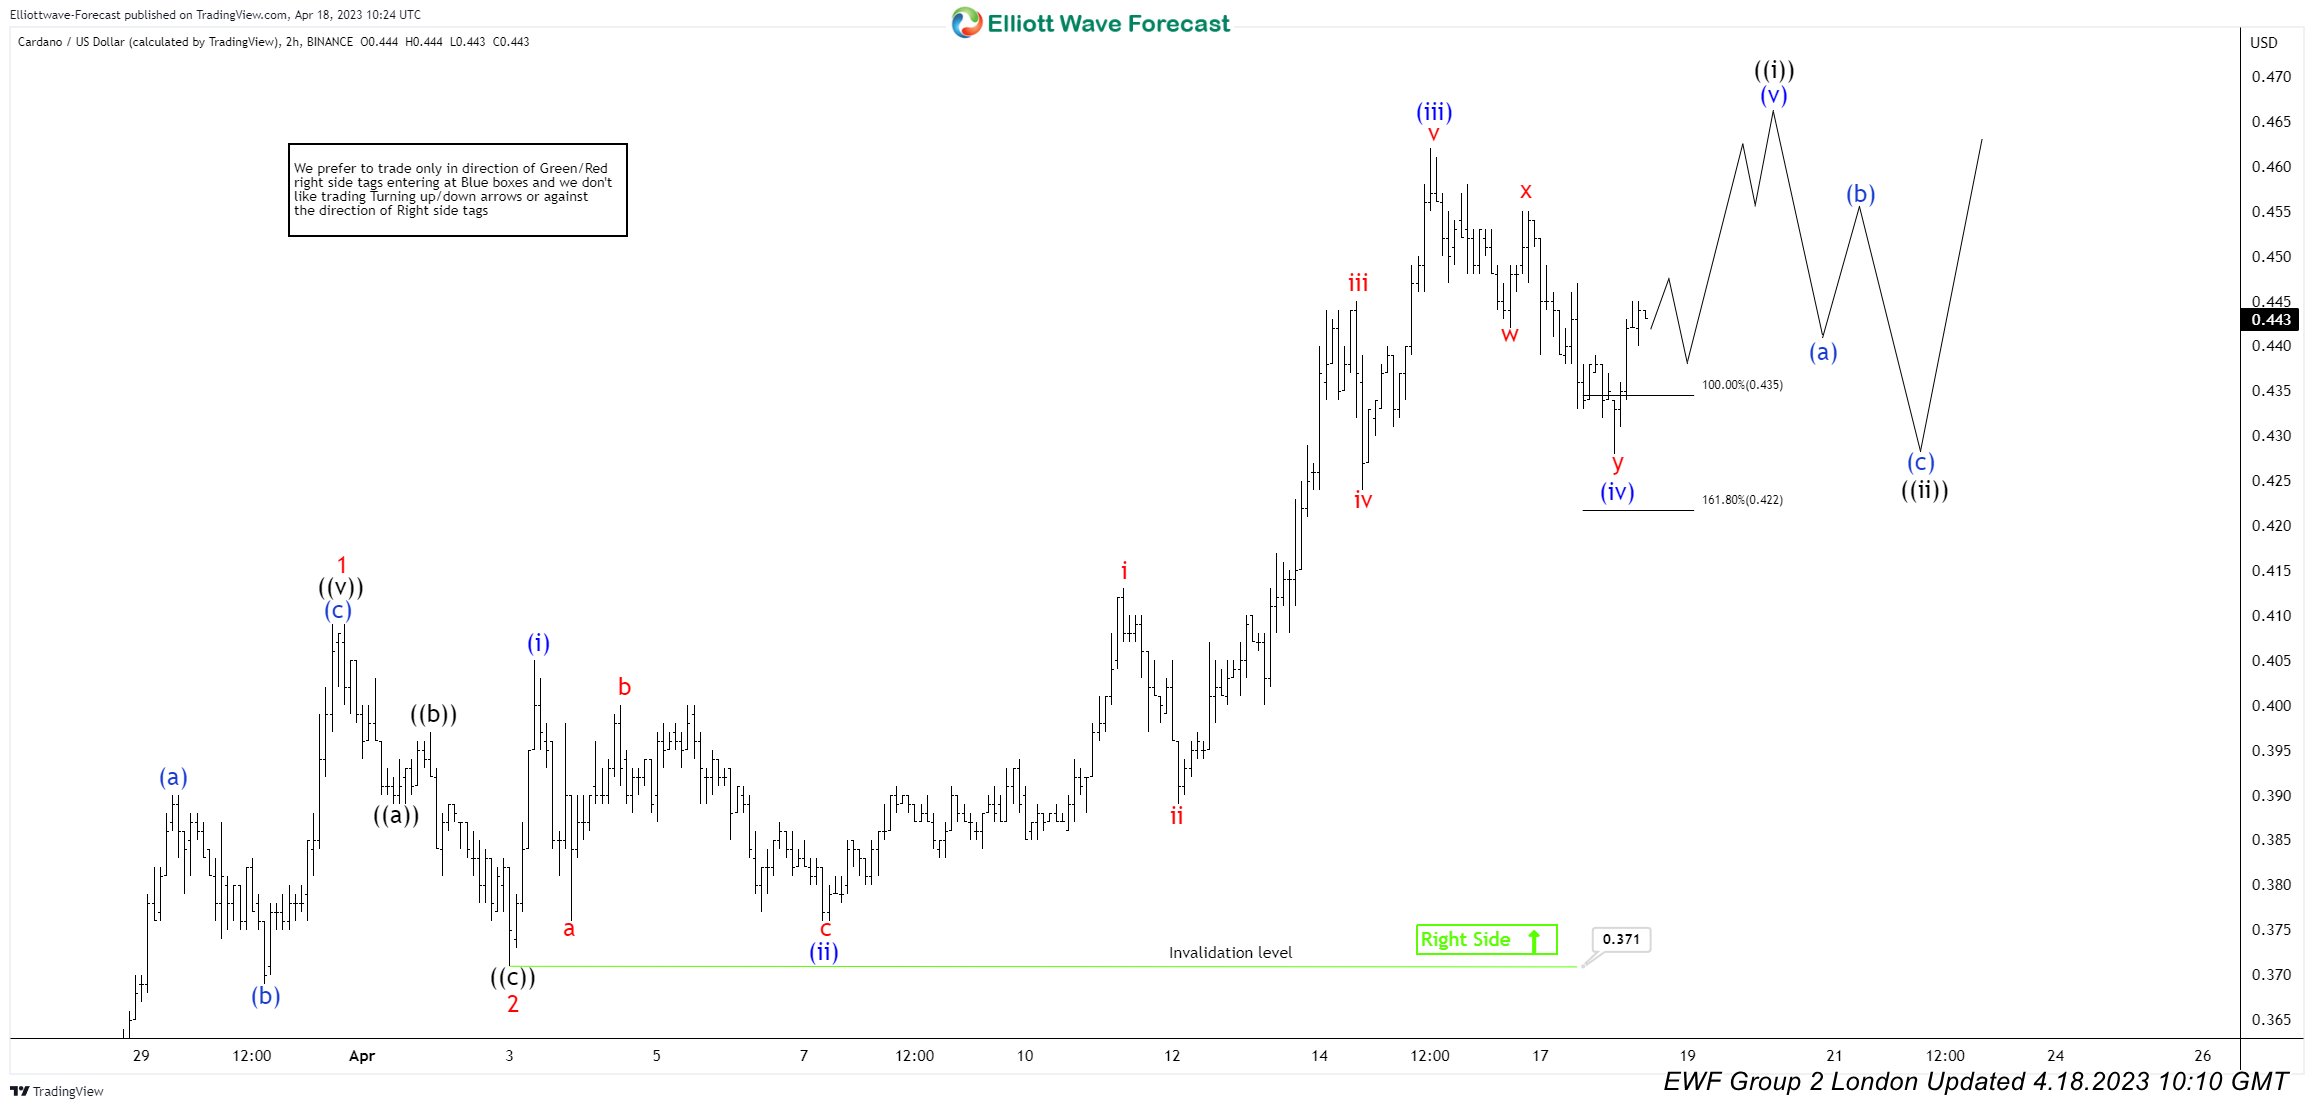
Above is the Latest Elliott wave Chart from the 4/18/2023 London update. In which the pair is showing a reaction higher taking place from the equal legs area. Right after ending the double correction. Allowed members to create a risk-free position shortly after taking a long position. But a break above $0.462 high would still be needed to confirm the next leg higher minimum towards $0.469- $0.482 area before the next pullback takes place.
Source: https://elliottwave-forecast.com/cryptos/cardano-reacting-higher-equal-legs-area/