
Fortinet (NASDAQ: FTNT) resumed its bullish trend and broke to new all-time highs. Today, we dive into its weekly technical chart. Our analysis explores the Elliott Wave structure and projected target for the current cycle.
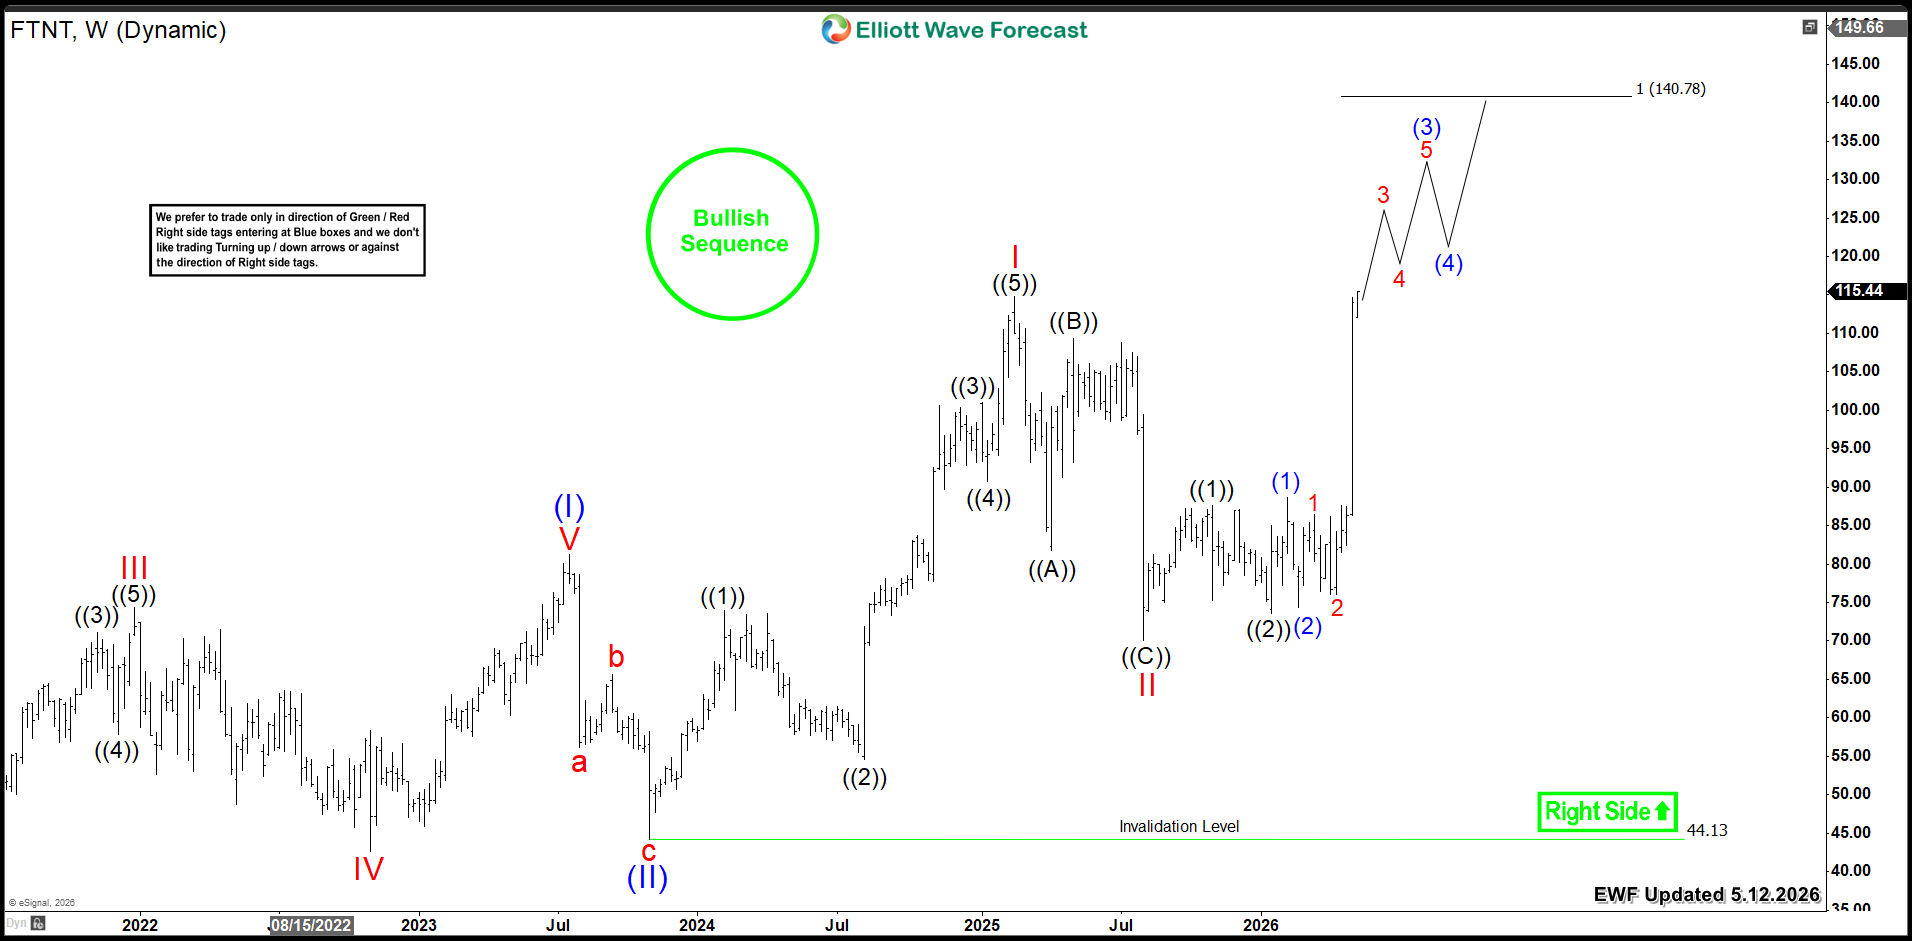
Looking at Fortinet’s weekly chart, the stock ended a major three-wave correction in wave (II). This bottom occurred in 2023 at $44. Then, a new bullish cycle began.
FTNT rallied within wave I, peaking at 114. Subsequently, wave II corrected lower to 70. From there, the stock resumed its rally within wave III. This established a nesting structure from the lows. The strong third wave is currently unfolding as the stock is accelerating to the upside after breaking above its 2025 peak. It should extend higher through a series of third and fourth waves.
Fortinet holds a bullish sequence from its 2023 low. The minimum target is within the equal legs area $140. However, wave III could extend further toward the golden ratio at $180.
Fortinet FTNT Weekly Chart 5.12.2026
Conclusion
Fortinet’s (FTNT) bullish cycle remains in progress. The stock is looking for further upside extension. Therefore, investors should target buying opportunities within daily pullbacks.
Source: https://elliottwave-forecast.com/stock-market/fortinet-ftnt-bullish-breakout-toward-140/