In this technical blog, we will look at the past performance of the 1-hour Elliott Wave Charts of USDCAD. In, the rally from 15 November 2022 low unfolded in a corrective sequence but provided an extreme trading opportunity. In this case, the pullback managed to reach the equal legs area & provided a buying opportunity. So, we advised members not to sell it but to buy the equal legs area for a minimum reaction higher to happen. We will explain the structure & forecast below:
USDCAD 1-Hour Elliott Wave Chart From 12.13.2022
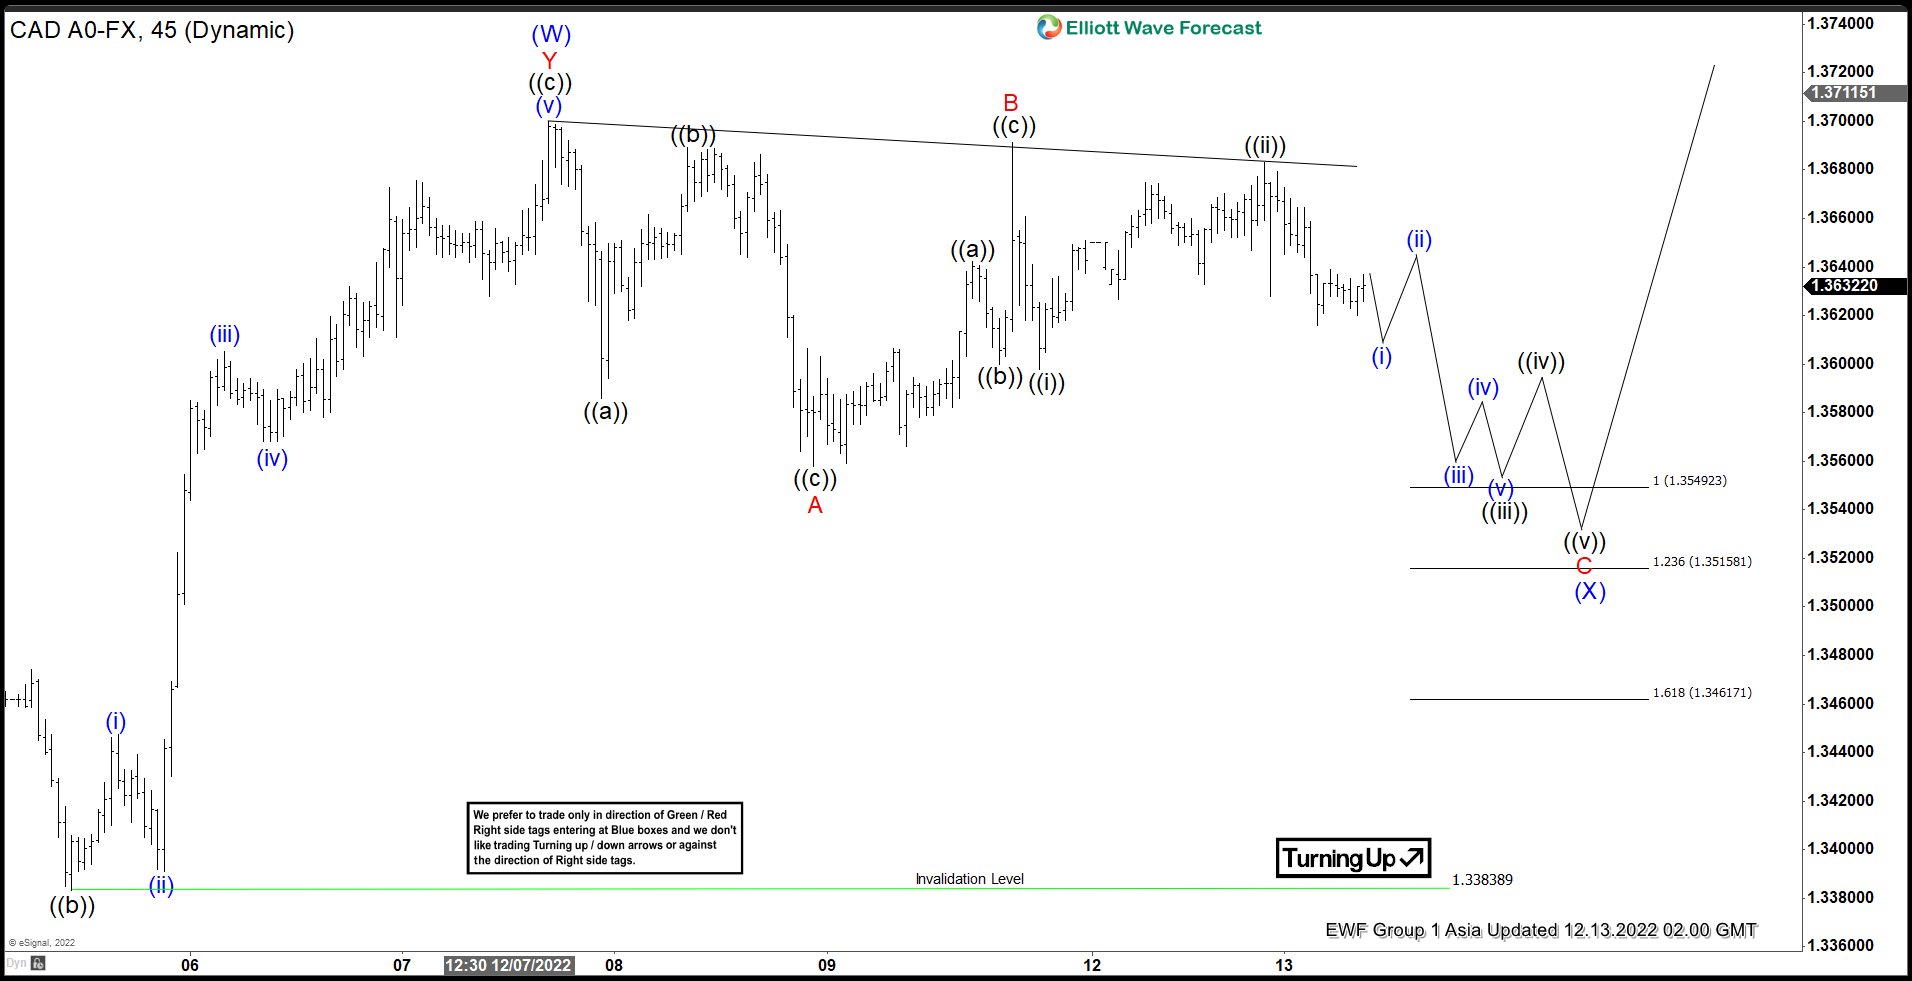
Here’s the Elliott wave Chart from the 12/13/2022 Asia update. In which, the rally to $1.3700 high ended the wave (W) & made a pullback in wave (X). The internals of that pullback unfolded as Elliott wave flat structure where wave A ended at $1.3558 low. Then a bounce to $1.3691 high ended wave B & started the next leg lower in wave C towards $1.3549- $1.3461 equal legs area. From there, buyers were expected to appear looking for new highs ideally or for a 3-wave bounce minimum.
USDCAD 1-Hour Elliott Wave Chart From 12.17.2022
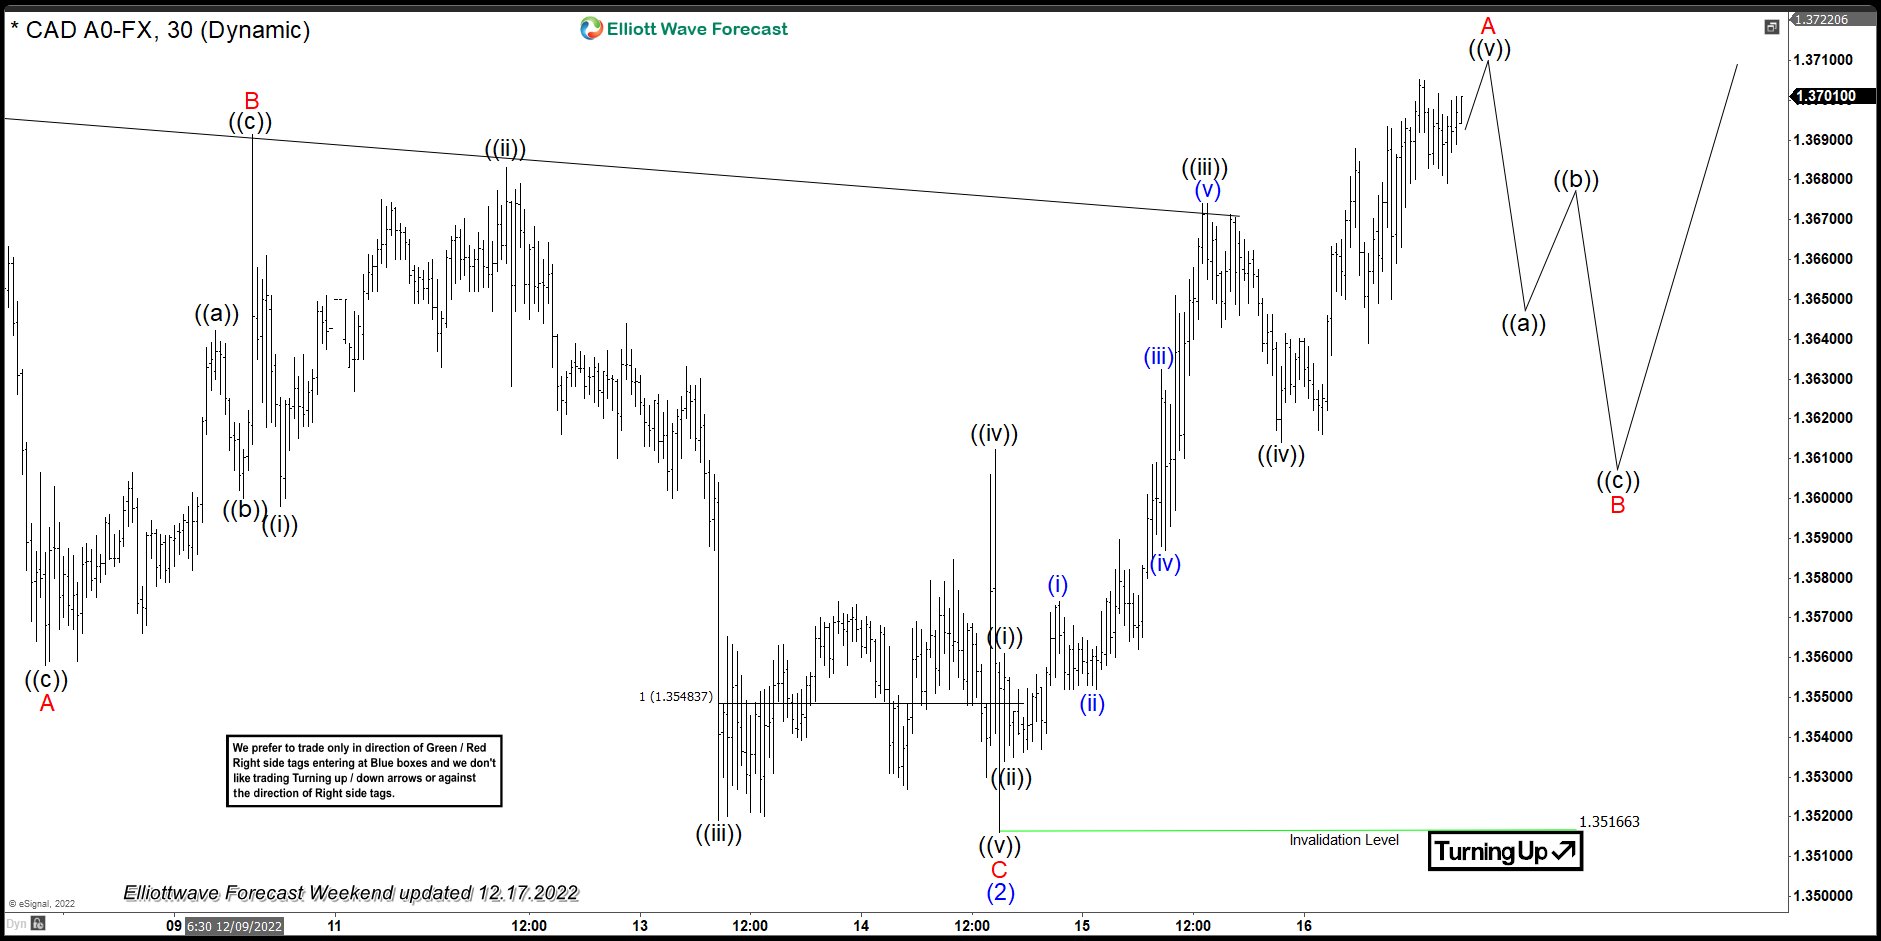
Above is the Elliott wave Chart from the 12/17/2022 Weekend update. In which the pair is showing a reaction higher taking place from the equal legs area. Right after ending the zigzag correction. Allowed members to create a risk-free position shortly after taking a long position. Since then the pair has managed to make a new high above $1.3700 high confirming the next extension higher.
Source: https://elliottwave-forecast.com/forex/usdcad-producing-strong-reaction-higher-equal-legs-area/