In this technical blog, we will look at the past performance of 4 hour Elliott Wave Charts of XLY. In which, the rally from 18 March 2020 low unfolded as a nest and showed a higher high sequence. Therefore, we knew that the structure in XLY is incomplete to the upside & should see more upside. So, we advised members not to sell the ETF & buy the dips in 3, 7, or 11 swings at the blue box areas. We will explain the structure & forecast below:
XLY 4 Hour Elliott Wave Chart
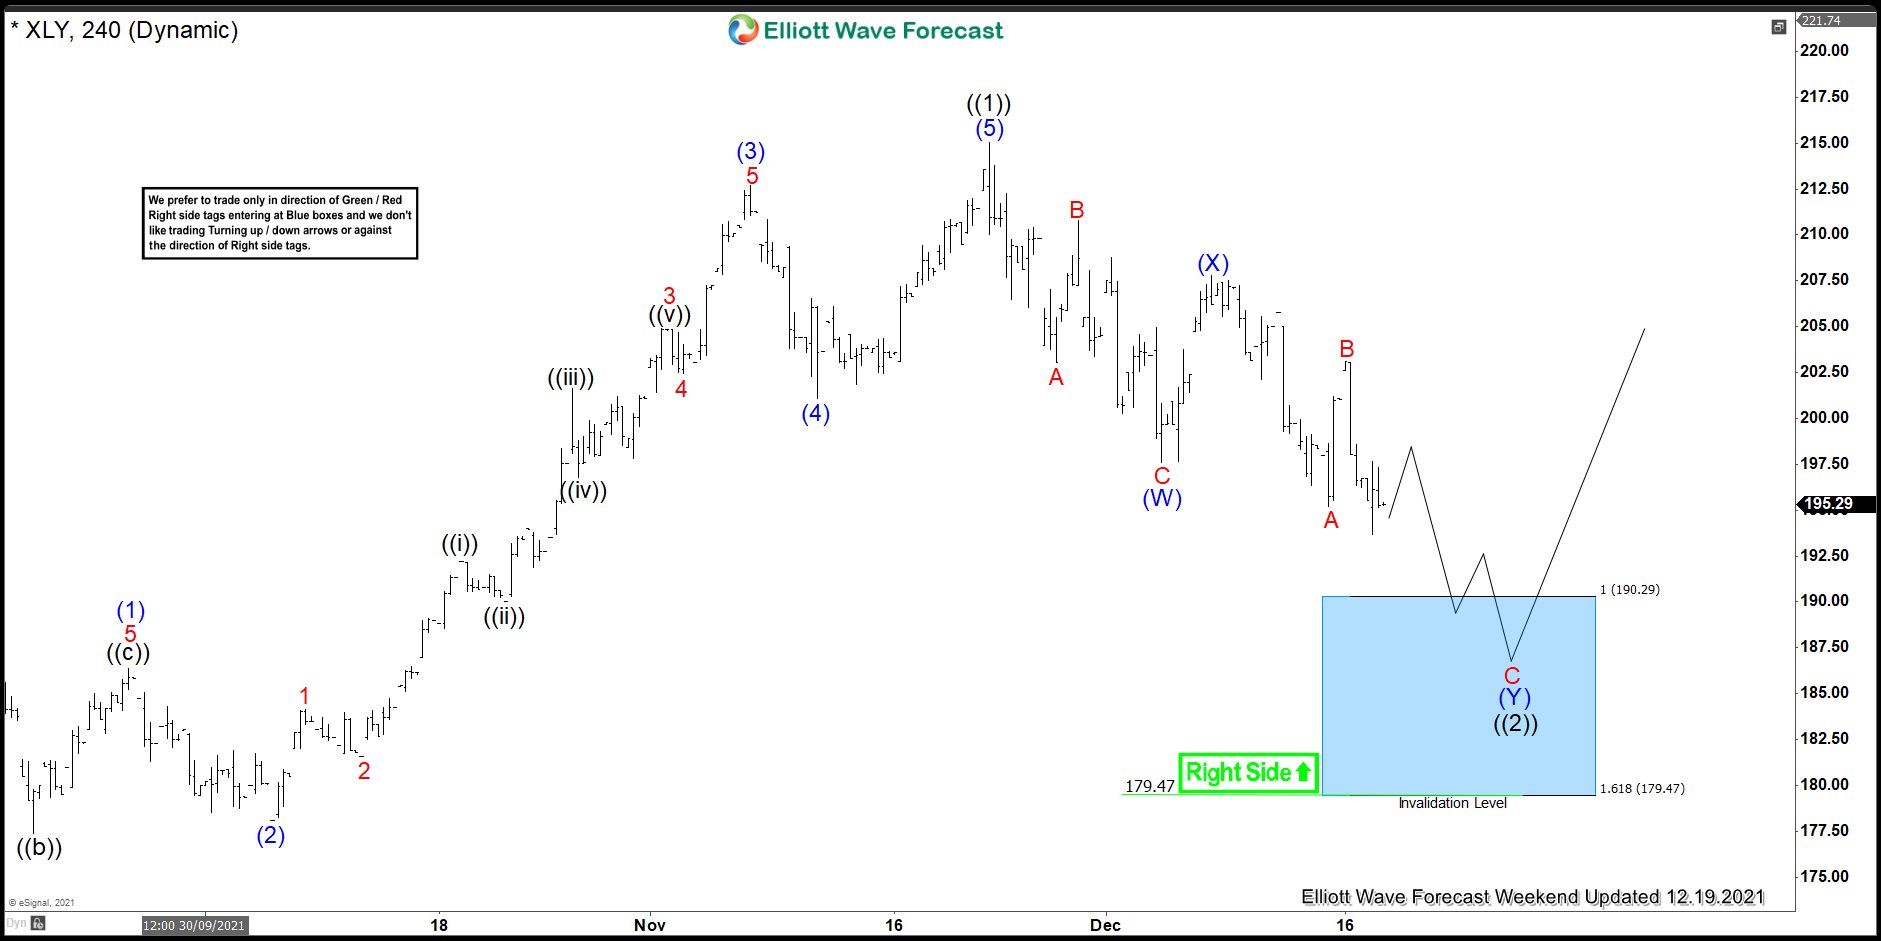
Here’s 4hr Elliott wave Chart from the 12/19/2021 Weekend update. In which, the rally to $215.06 high ended 5 waves from 3/05/2021 low & made a pullback. The internals of that pullback unfolded as Elliott wave double three structure where wave (W) ended in 5 swings at $197.60 low. Then a bounce to $207.78 high ended wave (X) & started the next leg lower in wave (Y) towards $190.29- $179.47 blue box area. From there, buyers were expected to appear looking for new highs ideally or for a 3 wave bounce minimum.
XLY 4 Hour Elliott Wave Chart
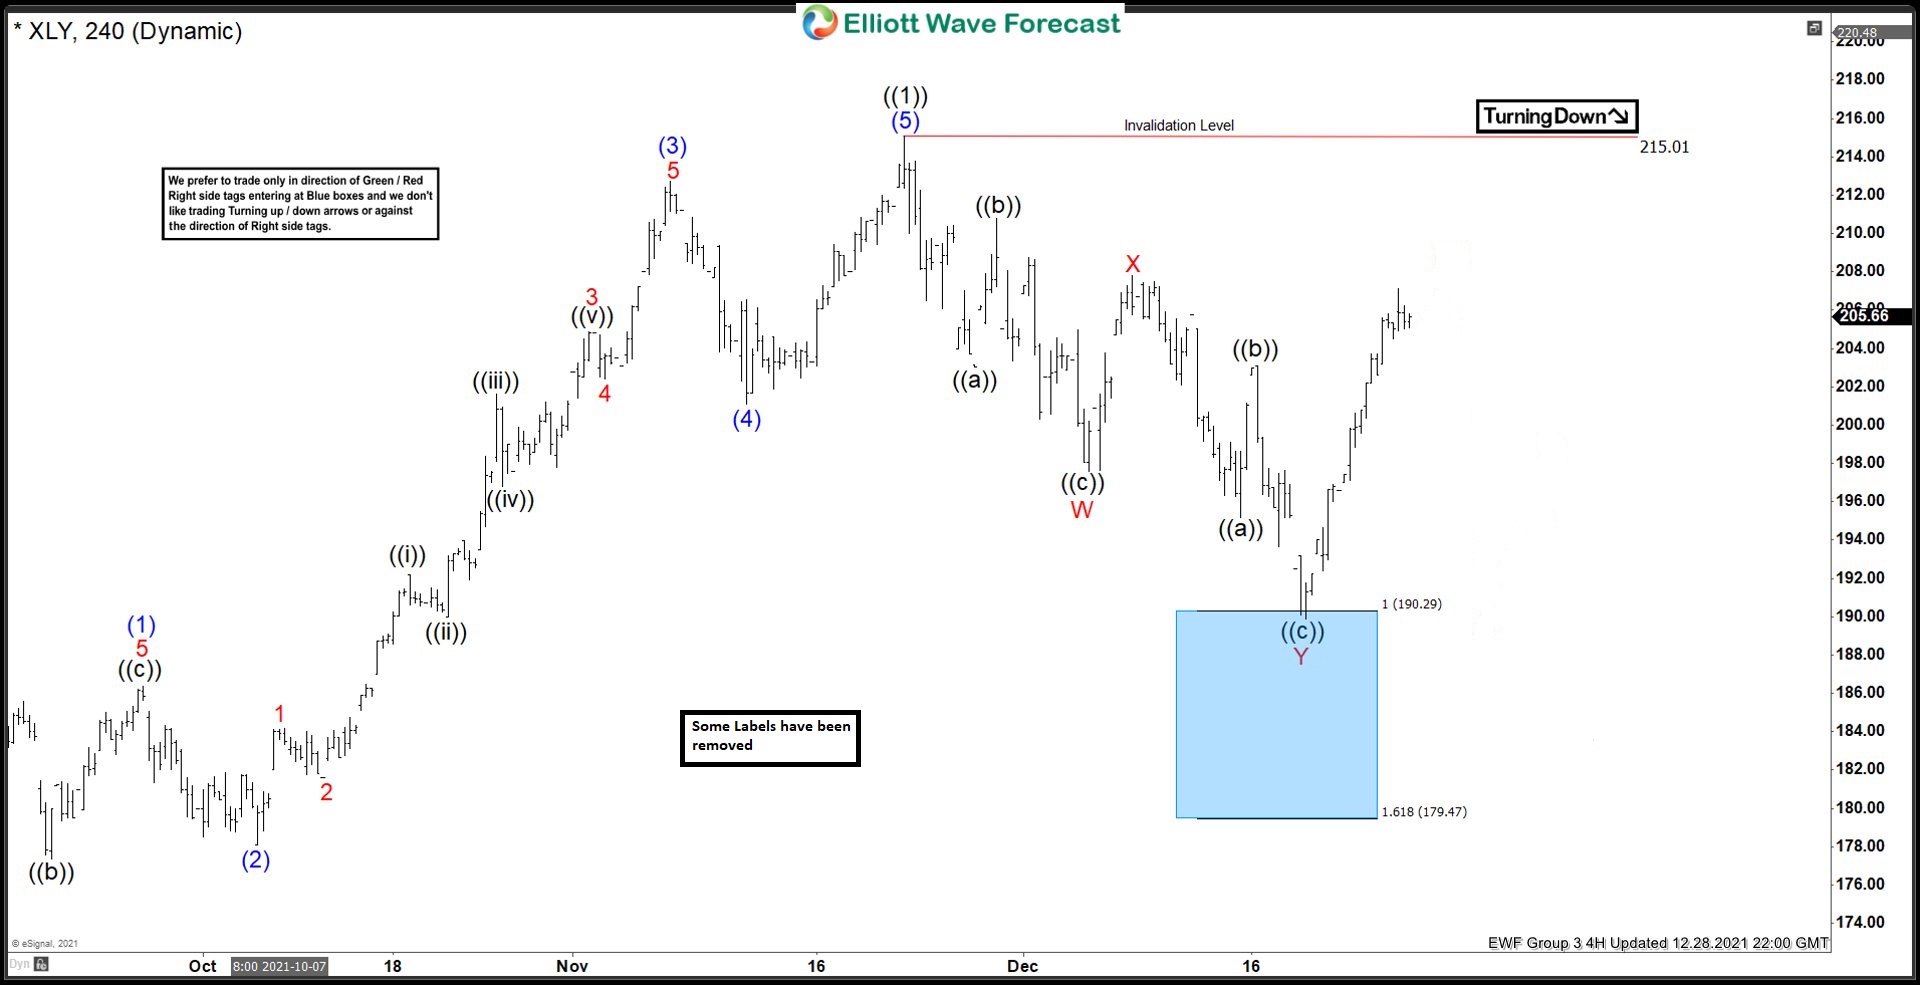
This is the 4hr Elliott wave Chart from the 12/28/2021 update. In which the ETF is showing a reaction higher taking place from the blue box area at $190.29- $179.47. Right after ending the double three correction within the blue box area. Allowed members to create a risk-free position with the minimum reaction higher towards 50%- 76.4% Fibonacci retracement from the peak. However, as far as pivot from $215.06 high stays intact a double correction lower cannot be ruled out at this stage.
Source: https://elliottwave-forecast.com/stock-market/xly-reacting-higher-double-correction/