The Fed has indicated that they plan to continue to taper and start raising interest rates from near zero to curb the strongest inflation in four decades. A hawkish Fed, if followed through in action, may support in USD at least in the short term.
USDCAD Daily Chart
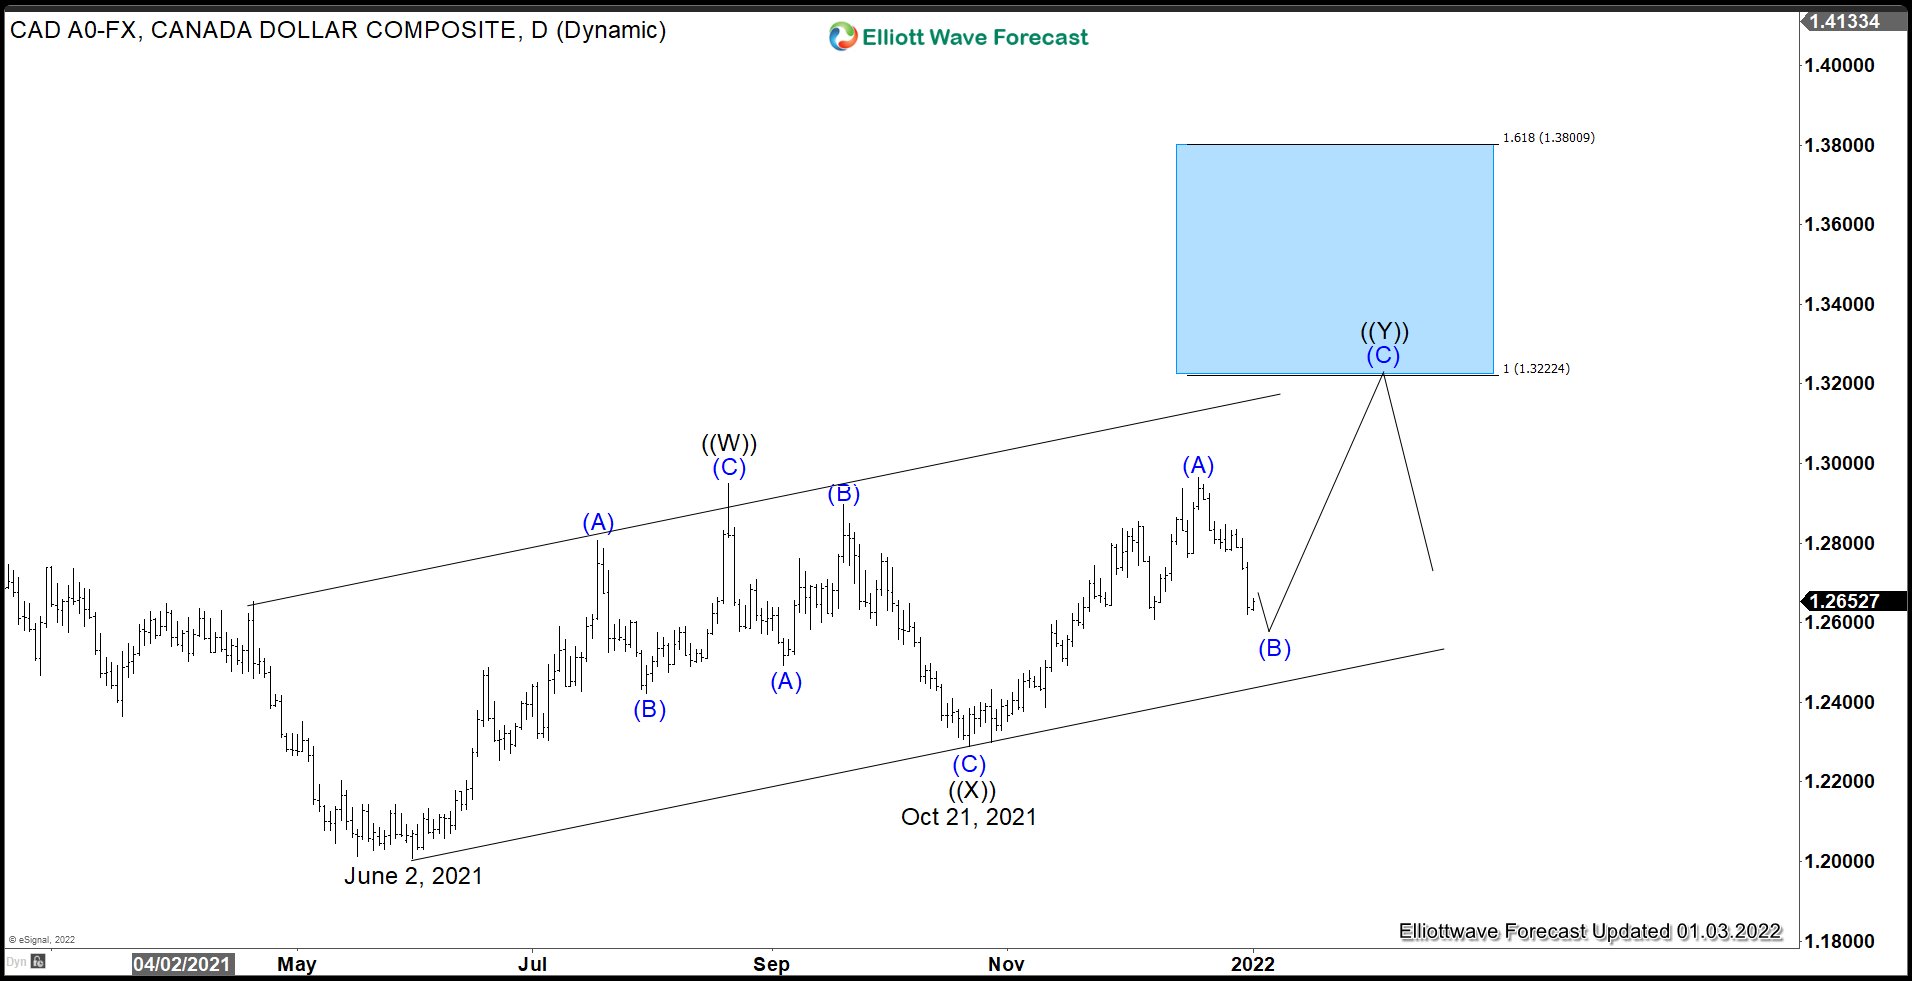
$USDCAD Daily Chart above shows an incomplete sequence from June 2, 2021 low favoring more upside. The rally from June 2 low can be counted as a double zig zag Elliott Wave structure. Up from June 2 low, wave ((W)) ended at 1.2949. Internal of wave ((W)) is unfolding as a zigzag where wave (A) ended at 1.2807, wave (B) ended at 1.2422, and wave (C) ended at 1.2949. Pullback in wave ((X)) ended at 1.2288 with internal unfolding as a zigzag. Down from wave ((W)), wave (A) ended at 1.249, wave (B) ended at 1.289, and wave (C) of ((X)) ended at 1.2288. Wave ((Y)) is in progress as a zigzag structure. Up from wave ((X)), wave (A) ended at 1.296. As far as wave (B) pullback holds above October 21, 2021 low (1.2288), expect the pair to continue higher.
USDCAD 1 Hour Chart

1 hour chart of USDCAD above shows that as far as it stays below 1.2847, the pair could see further downside before ending wave ((v)) of C. The pair has currently reached the 100% Fibonacci area from December 20, 2021 high which comes at 1.254 – 1.266. It can soon see support for more upside or a 3 waves rally at least.
Source: https://elliottwave-forecast.com/news/elliott-wave-view-usdcad-shows-bullish-sequence/