
Hello fellow traders. In this technical blog we’re going to take a quick look at the Elliott Wave charts of AT&T ($T) Stock, published in members area of the website. As our members know, the stock is showing incomplete bearish sequences in the cycles from the Jule 2016 and November 2019 peaks. We’ve been calling the decline in the stock and recommend members to avoid buying the stock, while favoring short selling. AT&T recently made the recovery that has had a form of Elliott Wave Zig Zag pattern. In the further text we are going to explain the Elliott Wave Pattern and trading strategy.
Before we take a look at the real market example, let’s explain Elliott Wave Zigzag.
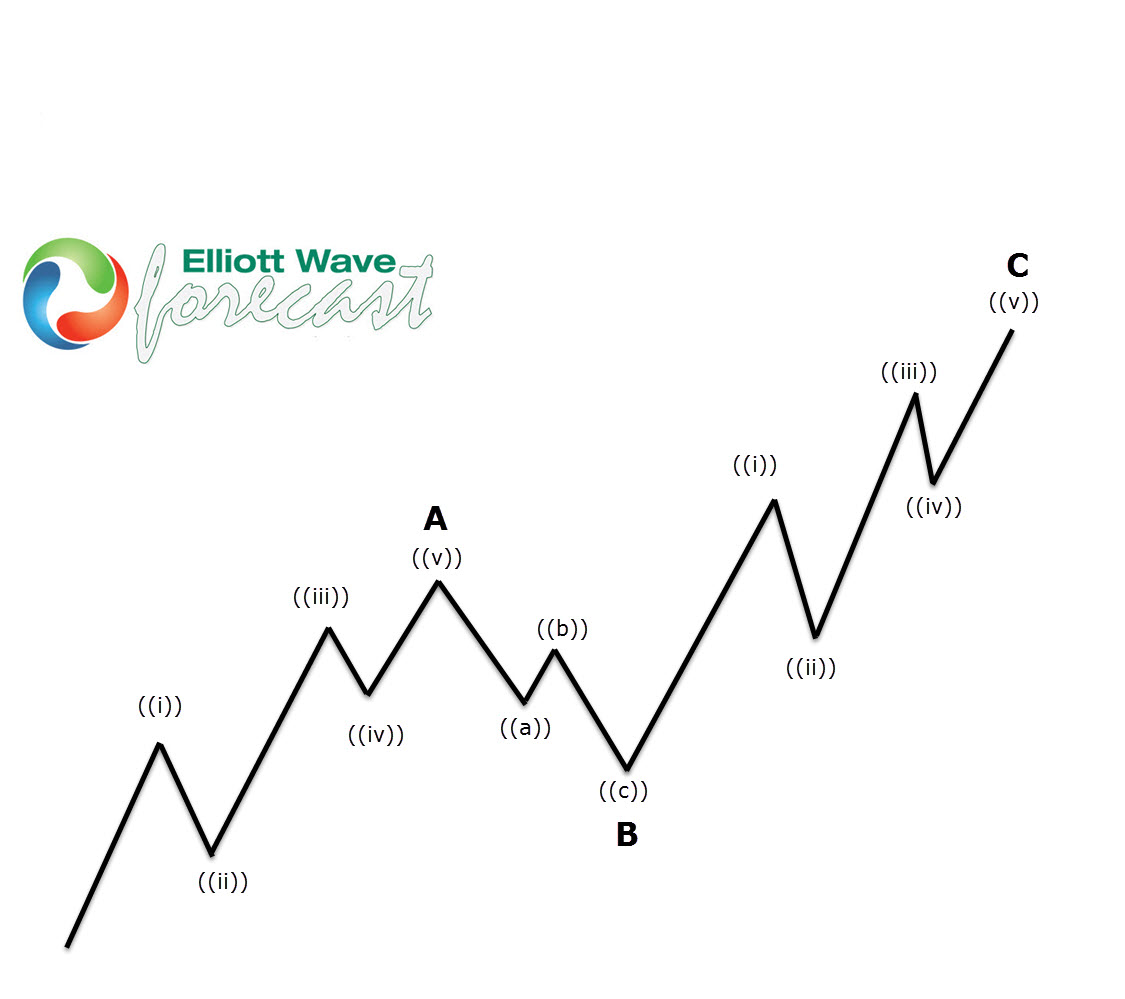
Elliott Wave Zigzag is the most popular corrective pattern in Elliott Wave theory . It’s made of 3 swings which have 5-3-5 inner structure. Inner swings are labeled as A,B,C where A =5 waves, B=3 waves and C=5 waves. That means A and C can be either impulsive waves or diagonals. (Leading Diagonal in case of wave A or Ending in case of wave C) . Waves A and C must meet all conditions of being 5 wave structure, such as: having RSI divergency between wave subdivisions, ideal Fibonacci extensions and ideal retracements.
Now, let’s take a look what Elliott Wave Zig Zag Pattern looks like in the real market.
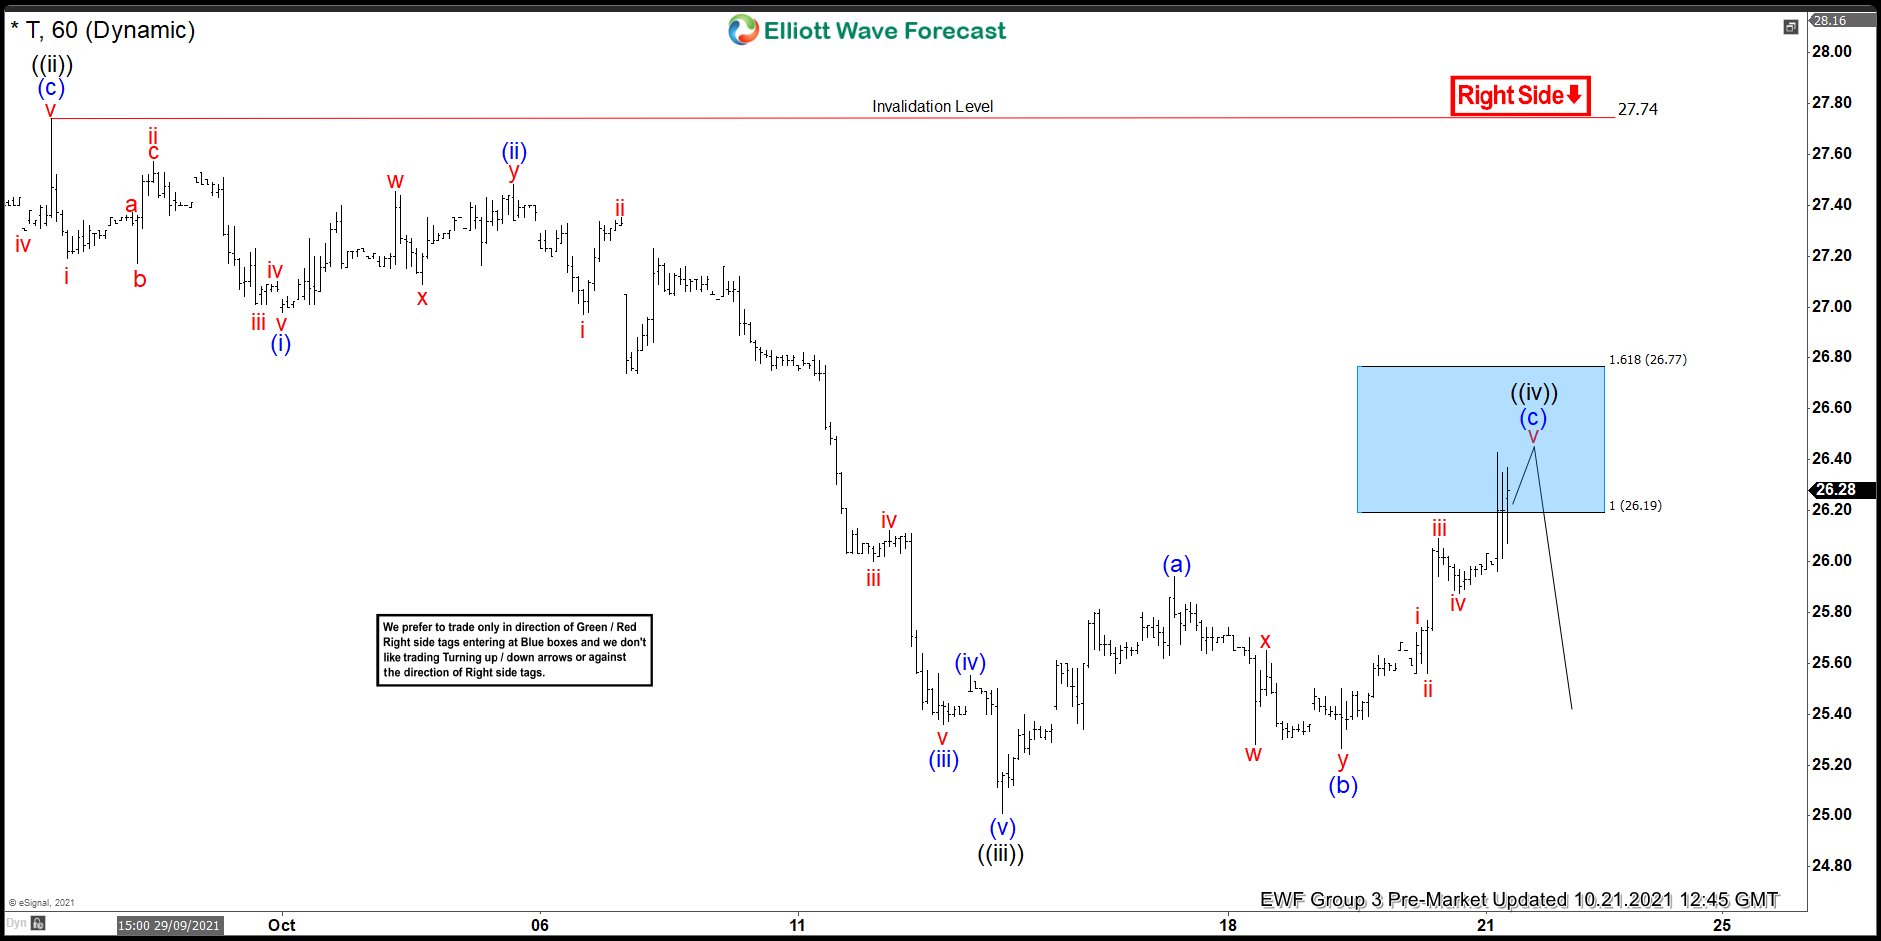
AT&T ( $T ) 1 Hour Elliott Wave Analysis 10.21.2021
AT&T is giving us (iv) black recovery that is unfolding as Elliott Wave Zig Zage Pattern. It’s having (a)(b) (c) blue inner labeling. The main characteristic of Zig Zag is that it has 5,3,5 structure. Waves (a) and (c) has 5 waves form, while (b) is 3 waves. The price reached Sellers zone at 26.19-26.77. Although another marginal push up withing the marked zone is possible, there is already enough number of swings in place. So, turn lower can be seen any moment. Invalidation for the short trade is break above 1.618 fib extension (1381’7). We don’t advise buying the stock and favor the short side from the Blue Box Area.
You can learn more about Elliott Wave Theory and Patterns at our Free Elliott Wave Educational Web Page.
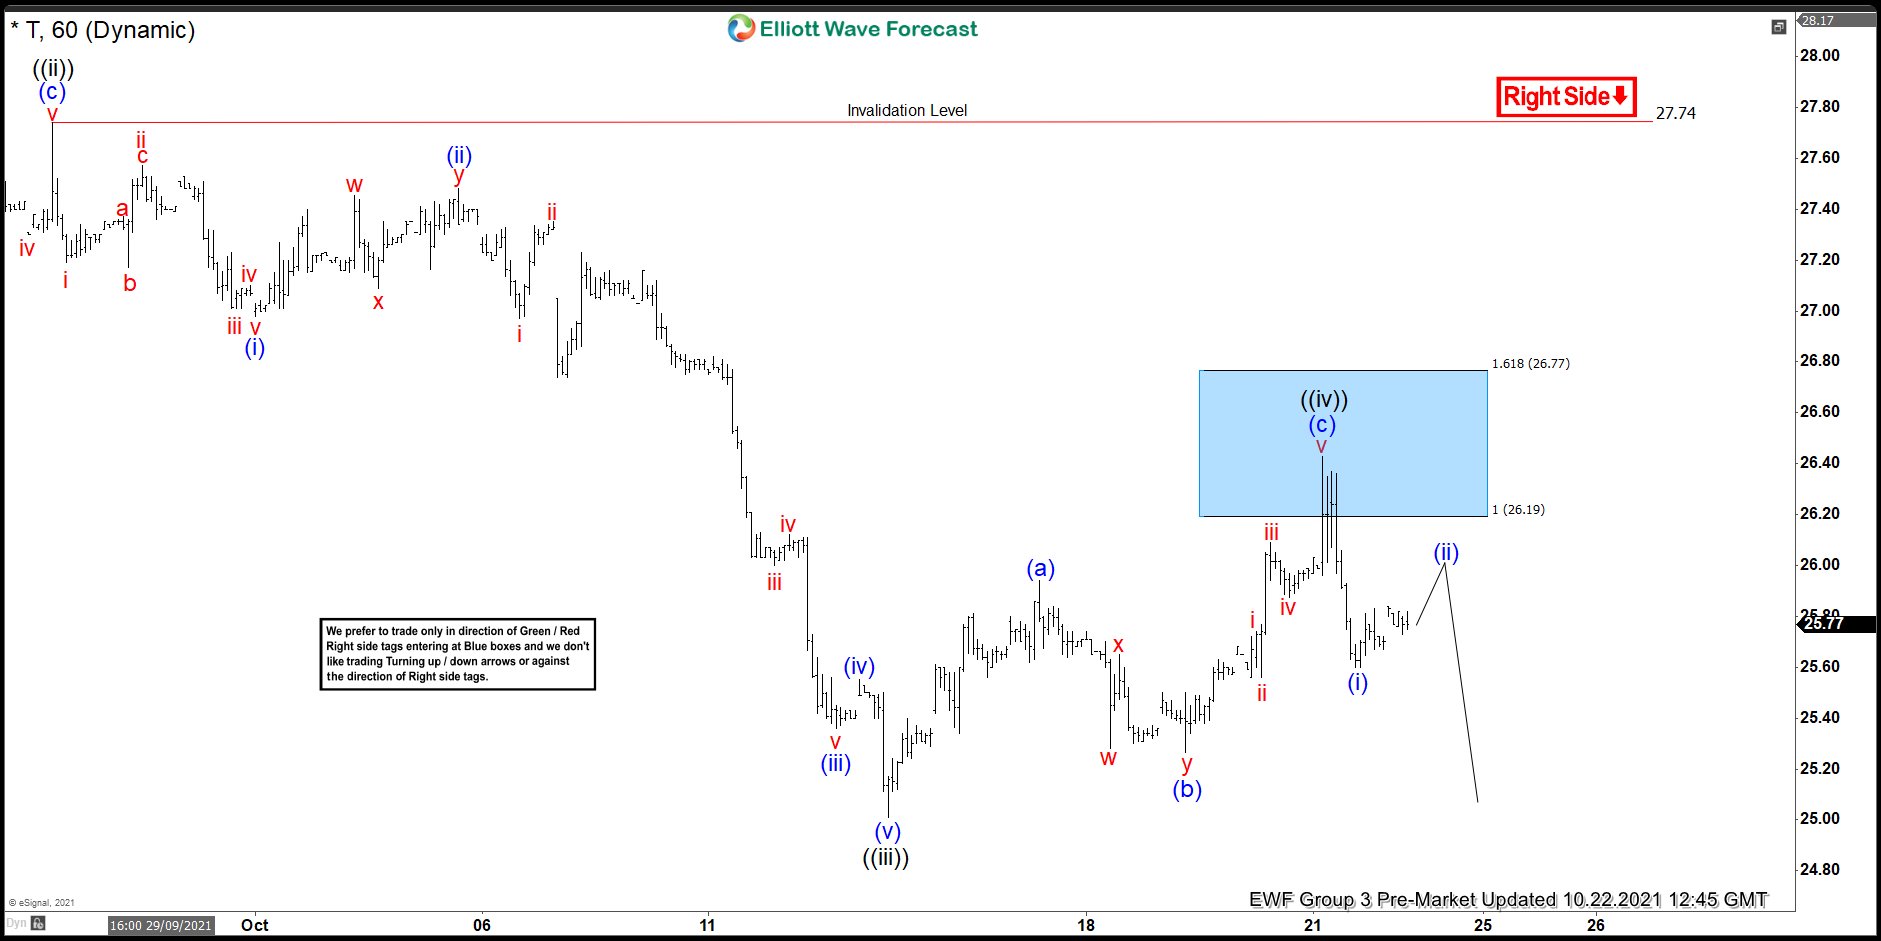
AT&T ( $T ) 1 Hour Elliott Wave Analysis 10.22.2021
Sellers appeared at the blue box and we got good reaction from there. The decline from the blue box reached 50 fibs against the (b) connector. As a result short positions from the blue box are Risk Free and partial profit are taken. Break of 13th October low – ((iii)) black is needed to confirm next leg down is in progress.
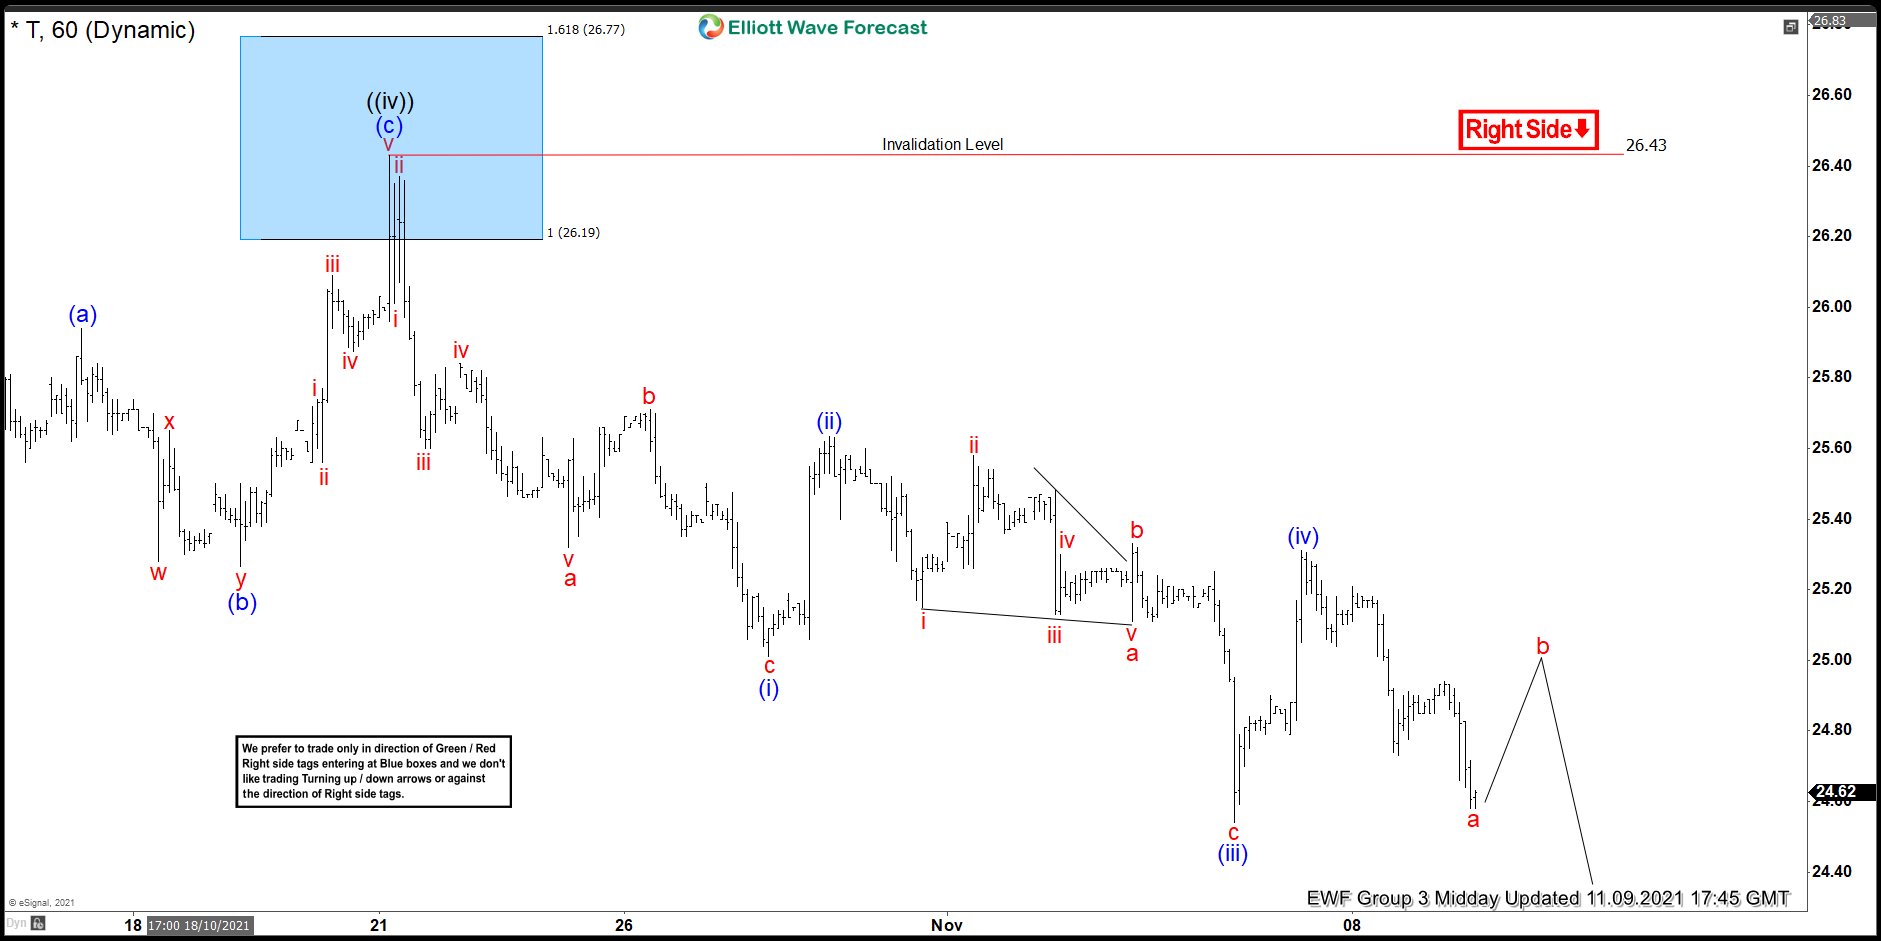
AT&T ( $T ) 1 Hour Elliott Wave Analysis 11.09.2021
Eventually the stock resume the decline and we got the break of 10/13 low. AT&T now remains bearish against the 26.43 pivot. The stock is still expected to keep finding sellers as far as 26.43 pivot holds. Keep in mind that market is dynamic and presented view could have changed in the mean time. You can check most recent charts in the membership area of the site. Best instruments to trade are those having incomplete bullish or bearish swings sequences. We put them in Sequence Report and best among them are shown in the Live Trading Room.
Elliott Wave Forecast
Source: https://elliottwave-forecast.com/trading/att-t-stock-decline-selling-rallies/