
In this technical blog, we are going to take a look at the past performance of EURNZD, 1-Hour Elliott wave Charts. In which, the decline from 12/22/2020 peak took place as an impulse Elliott wave structure with right side tag pointing lower called for more downside. Therefore, our members knew that selling the bounces in the direction of the right side tag remained the preferred path. We will explain the Elliott wave structure & selling opportunity our members took below:
EURNZD 1 Hour Elliott Wave Chart
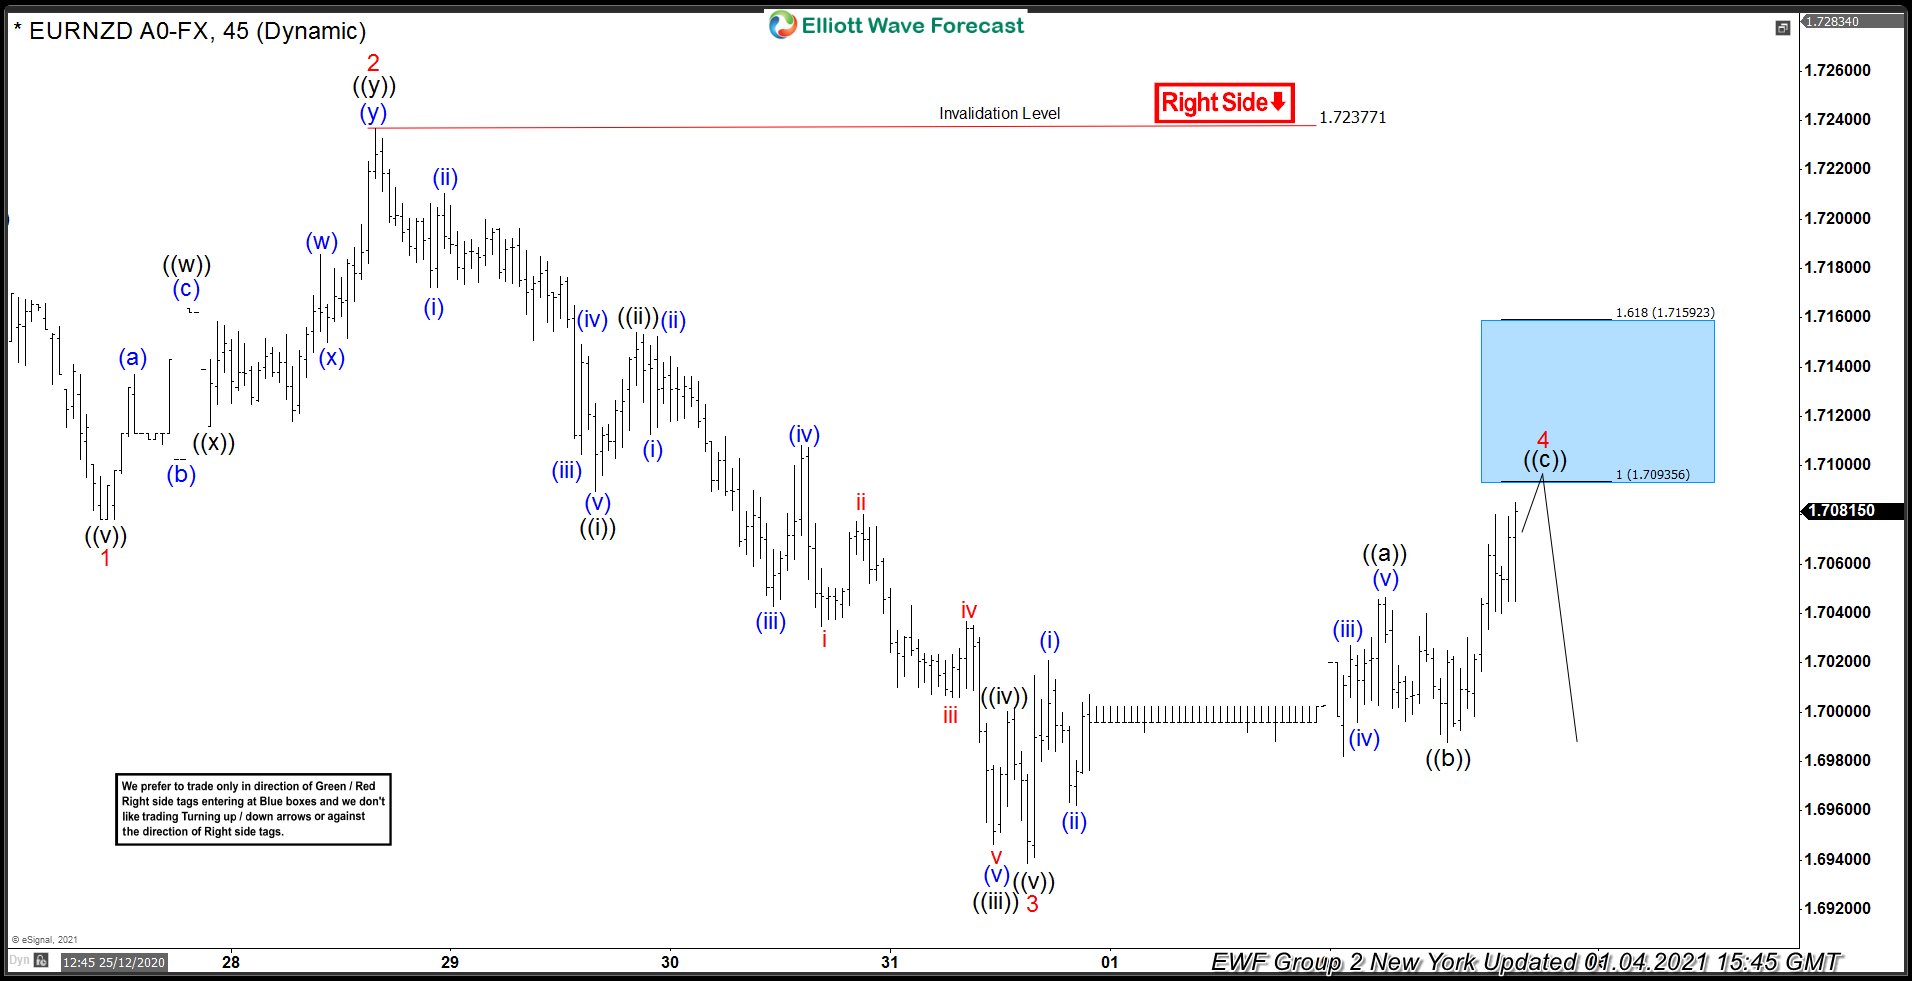
Above is the 1 Hour Elliott wave Chart of EURNZD from the 1/04/2021 NY update. In which, the decline from 12/22/2020 peak is unfolding as an impulse sequence where wave 1 ended at 1.7078 low. Wave 2 bounce ended at 1.7237 high as a lesser degree double three structure. Down from there, the decline to 1.6938 low ended wave 3 & made a wave 4 bounce higher. Therefore, our strategy remained to sell wave 4 on the bounces. While the internals in wave 4 bounce unfolded as an Elliott wave zigzag structure where wave ((a)) ended at 1.7046 high. Wave ((b)) pullback ended at 1.6987 low and wave ((c)) was expected to reach 1.7093- 1.7159 100%-161.8% Fibonacci extension area of ((a))-((b)). From there, sellers were expected to appear again looking for more downside.
EURNZD 1 Hour Elliott Wave Chart

Here’s a 1 Hour Elliott wave Chart from 1/05/2021 NY Midday update. In which, the pair is showing reaction lower taking place from the blue box area. Allowed shorts to get into a risk-free position shortly after taking the short position at 1.7093- 1.7159 blue box area.
Source: https://elliottwave-forecast.com/forex/eurnzd-resume-trend-blue-box-area/